Brighton, England · 244 matches on record
T20I Evenly balanced between batting first and chasing at County Ground, based on 11 decided matches.
| Format | M | Avg 1st | Avg 2nd | Bat 1st won | Chased | Highest | Lowest | Top chase | Low defended | RR | Bdry % |
|---|---|---|---|---|---|---|---|---|---|---|---|
| T20I | 11 | 114 | 88 | 5 | 6 | 186 | 42 | 128 | 89 | 6.20 | 50 |
| ODI | 4 | 254 | 226 | 2 | 2 | 331 | 203 | 232 | 256 | 5.30 | 45.2 |
| T20 | 97 | 167 | 149 | 41 | 47 | 258 | 23 | 211 | 134 | 8.46 | 60 |
| List A | 52 | 271 | 218 | 27 | 23 | 427 | 50 | 348 | 209 | 5.73 | 51 |
| First-class | 80 | 313 | 332 | 30 | 18 | 756 | 1 | 534 | 105 | 3.58 | 56.1 |
Last first innings: 80/10, 80/10, 81/9, 81/9, 89/6
| Phase | Run rate | Wkts |
|---|---|---|
| powerplay | 6.59 | 39 |
| middle | 6.46 | 35 |
| death | 5.95 | 31 |
Based on 11 matches.
Last first innings: 227/7, 331/6, 203/4, 256/6
| Phase | Run rate | Wkts |
|---|---|---|
| powerplay | 4.44 | 8 |
| middle | 5.38 | 29 |
| death | 6.30 | 13 |
Based on 4 matches.
Last first innings: 186/5, 204/6, 132/8, 171/10, 133/8
| Phase | Run rate | Wkts |
|---|---|---|
| powerplay | 8.55 | 318 |
| middle | 8.08 | 505 |
| death | 9.27 | 398 |
Based on 97 matches.
Last first innings: 383/9, 333/9, 325/7, 222/6, 320/5
| Phase | Run rate | Wkts |
|---|---|---|
| powerplay | 5.09 | 122 |
| middle | 5.55 | 387 |
| death | 8.37 | 184 |
Based on 52 matches.
Last first innings: 237/10, 393/10, 202/10, 460/10, 191/10
| Phase | Run rate | Wkts |
|---|---|---|
| first | 3.44 | 845 |
| middle | 3.49 | 948 |
| late | 3.93 | 648 |
Based on 80 matches.
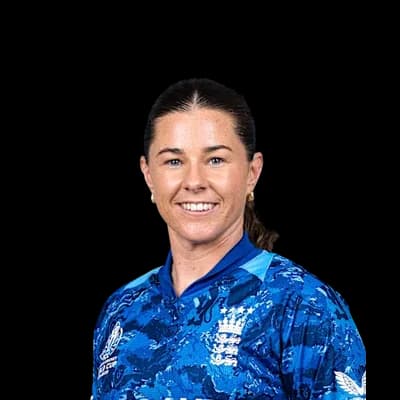 Tammy Beaumont115
 Heather Knight107
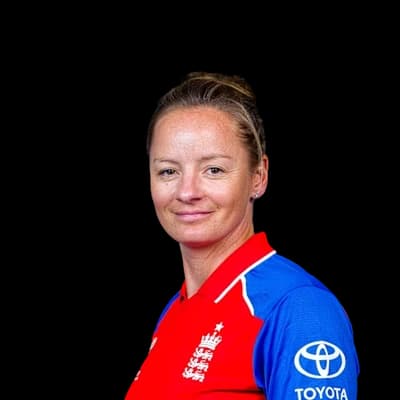 Danielle Wyatt Hodge102
 Maia Bouchier89
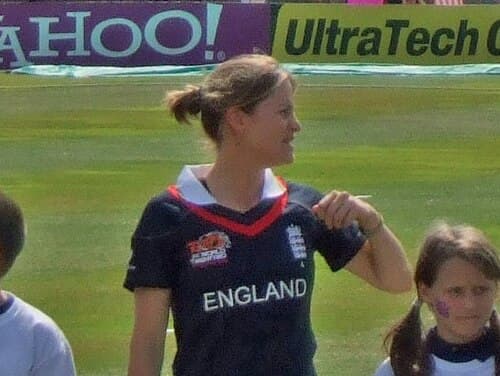 Lydia Greenway87
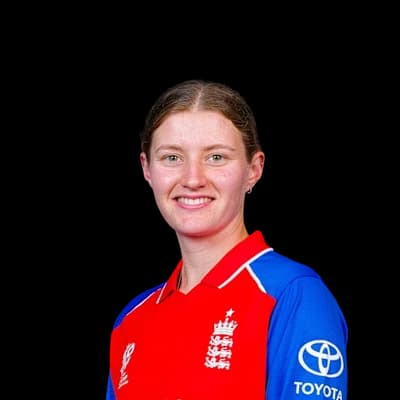 Charlotte Dean8Danielle Hazell5
 Lauren Bell4
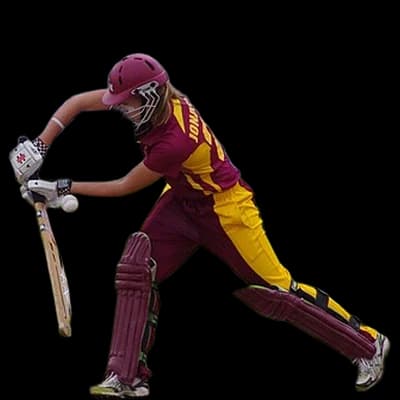 Jess Jonassen3
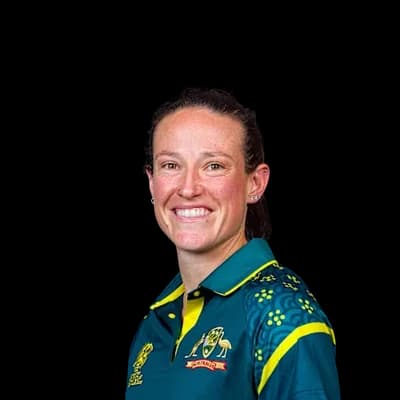 Megan Schutt3
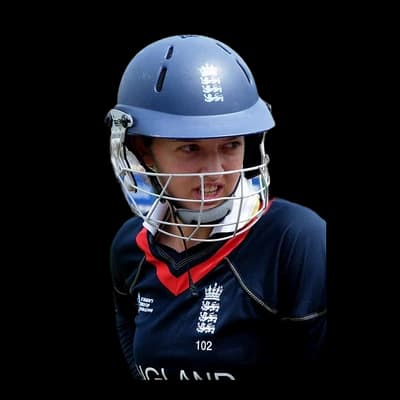 Sarah Taylor214Heather Knight124
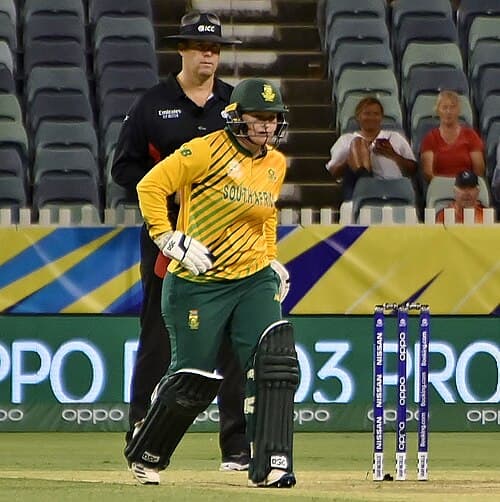 Lizelle Lee117
 Jess Cameron109Tammy Beaumont108
 Katherine Brunt4
 Anya Shrubsole3
 Laura Marsh3
 Sarah Coyte3
 Sophie Ecclestone3
 Luke Wright1365
 Chris Nash801
 Tom Alsop779
 Phil Salt770
 Laurie Evans755
 Tymal Mills98Will Beer37
 Ollie Robinson35Danny Briggs35
 Chris Jordan35
 Tom Haines783Luke Wright690Tom Clark587
 Ben Brown539
 Cheteshwar Pujara498
 Henry Thomas Crocombe28Ollie Robinson19Danny Briggs19
 David Wiese18
 Aristides Karvelas17
Photos: ICC, Harrias, CC BY-SA 4.0, via Wikimedia Commons, Naparazzi, CC BY-SA 2.0, via Wikimedia Commons, paddynapper, CC BY-SA 2.0, via Wikimedia Commons, Bahnfrend, CC BY-SA 4.0, via Wikimedia Commons, NAPARAZZI, CC BY-SA 2.0, via Wikimedia Commons, The Eternal Optimist (talk), CC BY-SA 3.0, via Wikimedia Commons, Dave Morton, Public domain, via Wikimedia Commons, Shammay14, CC0, via Wikimedia Commons, Number 10, CC BY 2.0, via Wikimedia Commons, Dave Morton, PDM-owner, via Wikimedia Commons
13°C
rain
Feels 9°C · Humidity 91% · Wind 27.7 km/h · Cloud 95%
Rain outlook: rain very likely to interrupt
Dew: possible – Dew is possible from about 05:00; the side bowling second may find the ball wet.
| Team | Format | P | W | L | Win % | Avg | Highest |
|---|---|---|---|---|---|---|---|
| Sussex | T20 | 82 | 32 | 43 | 39% | 156 | 222 |
| Sussex | First-class | 79 | 28 | 20 | 35% | 294 | 668 |
| Sussex | List A | 41 | 13 | 26 | 32% | 255 | 400 |
| Hampshire | T20 | 13 | 8 | 5 | 62% | 183 | 249 |
| Kent | T20 | 11 | 5 | 5 | 45% | 159 | 195 |
| Surrey | T20 | 11 | 6 | 2 | 55% | 184 | 258 |
| Essex | T20 | 10 | 7 | 2 | 70% | 172 | 211 |
| Gloucestershire | T20 | 10 | 6 | 4 | 60% | 152 | 189 |
Nottinghamshire 237/10 (84.4) · Sussex 349/10 (110.2) · Nottinghamshire 191/10 (67.5) · Sussex 76/3 (18.0)
SUS won by 7 wickets
Sussex 393/10 (104.0) · Surrey 321/10 (104.4) · Sussex 167/3 (65.0)
draw
Somerset 202/10 (58.0) · Sussex 250/10 (69.4) · Somerset 350/9 (97.2) · Sussex 62/1 (14.0)
draw
Hampshire 383/9 (50.0) · Sussex 332/10 (48.5)
Sussex 333/9 (50.0) · Worcestershire 334/6 (48.2)
The average first-innings score at County Ground in T20Is is 114, across 11 matches in our records. The par score (middle of the last 10 first innings) is 107.
In T20Is at County Ground, sides batting first have won 45% of decided matches (5) and chasing sides 55% (6). Evenly balanced between batting first and chasing.
The highest T20I total at County Ground is 186, and the lowest is 42.
The highest successful T20I chase at County Ground is 128. The lowest total defended is 89.
Pace bowlers have taken 49% of the wickets (with a known bowling type) in T20Is at County Ground, and spinners 51%.
Captains winning the toss in T20Is at County Ground chose to field 64% of the time, and the toss winner went on to win 36% of matches.
Tammy Beaumont has scored the most T20I runs at County Ground: 115 in 3 innings, averaging 38.3.
Charlotte Dean has taken the most T20I wickets at County Ground: 8 in 4 innings at an economy of 3.71.
Counted from UC Cricket's own ball-by-ball records; rebuilt nightly. Weather refreshes every few minutes.
