Northwood, England · 26 matches on record
T20 Batting first has the edge at Merchant Taylors' School Ground, based on 11 decided matches.
| Format | M | Avg 1st | Avg 2nd | Bat 1st won | Chased | Highest | Lowest | Top chase | Low defended | RR | Bdry % |
|---|---|---|---|---|---|---|---|---|---|---|---|
| T20 | 11 | 177 | 156 | 7 | 4 | 238 | 90 | 188 | 154 | 8.57 | 61.5 |
| List A | 5 | 186 | 178 | 2 | 3 | 276 | 76 | 208 | 177 | 4.83 | 41.2 |
| First-class | 10 | 308 | 215 | 6 | 2 | 625 | 114 | 264 | 172 | 3.31 | 54.4 |
Last first innings: 213/3, 176/5, 154/3, 126/7, 189/5
| Phase | Run rate | Wkts |
|---|---|---|
| powerplay | 8.71 | 29 |
| middle | 8.39 | 46 |
| death | 9.89 | 51 |
Based on 11 matches.
Last first innings: 177/10, 76/10, 276/7, 204/7, 199/8
| Phase | Run rate | Wkts |
|---|---|---|
| powerplay | 4.53 | 5 |
| middle | 5.02 | 28 |
| death | 7.51 | 8 |
Based on 5 matches.
Last first innings: 247/10, 350/10, 625/8, 207/10, 219/10
| Phase | Run rate | Wkts |
|---|---|---|
| first | 3.30 | 120 |
| middle | 3.11 | 150 |
| late | 3.92 | 76 |
Based on 10 matches.
 Stephen Eskinazi241
 Luke Hollman152
 Leus du Plooy148
 James Vince140
 Ryan Higgins138
 Tom Helm7
 Noah Cornwell6Luke Hollman6
 Danny Briggs6Blake Cullen5Toby Albert75
 Cordelia Griffith69Marie Kelly58James Vince56
 Mark Stoneman53
 Reece Topley4
 Kyle Abbott4Luke Hollman4
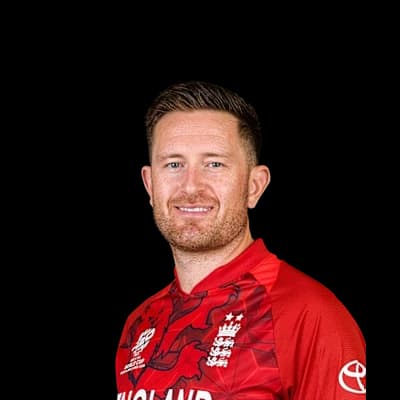 Liam Dawson2Sam Robson720Max Holden398Leus du Plooy301John Simpson287
 Dawid Malan268
 Toby Roland-Jones49Tom Helm31Ryan Higgins29
 Tim Murtagh28
 Ben Sanderson15
Photos: Dave Morton, Public domain, via Wikimedia Commons, Storm machine, CC BY-SA 4.0, via Wikimedia Commons, www.davidmolloyphotography.com from Sydney, Australia, CC BY 2.0, via Wikimedia Commons, ICC, NAPARAZZI, CC BY-SA 2.0, via Wikimedia Commons, Harrias, CC BY-SA 3.0, via Wikimedia Commons
| Team | Format | P | W | L | Win % | Avg | Highest |
|---|---|---|---|---|---|---|---|
| Middlesex | First-class | 10 | 6 | 2 | 60% | 270 | 625 |
| Middlesex | T20 | 10 | 1 | 9 | 10% | 164 | 209 |
| Gloucestershire | T20 | 3 | 2 | 1 | 67% | 170 | 181 |
| Hampshire | T20 | 3 | 3 | 0 | 100% | 172 | 198 |
| Northamptonshire | First-class | 3 | 0 | 2 | 0% | 249 | 380 |
| Glamorgan | T20 | 2 | 2 | 0 | 100% | 183 | 238 |
| Hampshire | List A | 2 | 2 | 0 | 100% | 238 | 276 |
| Middlesex | List A | 2 | 0 | 2 | 0% | 228 | 257 |
Middlesex 247/10 (68.3) · Lancashire 151/10 (48.5) · Middlesex 200/10 (44.0) · Lancashire 136/10 (43.4)
Kent 350/10 (91.3) · Middlesex 249/10 (55.4) · Kent 254/10 (68.4) · Middlesex 309/10 (73.4)
The average first-innings score at Merchant Taylors' School Ground in T20s is 177, across 11 matches in our records. The par score (middle of the last 10 first innings) is 181.
In T20s at Merchant Taylors' School Ground, sides batting first have won 64% of decided matches (7) and chasing sides 36% (4). Batting first has the edge.
The highest T20 total at Merchant Taylors' School Ground is 238, and the lowest is 90.
The highest successful T20 chase at Merchant Taylors' School Ground is 188. The lowest total defended is 154.
Pace bowlers have taken 66% of the wickets (with a known bowling type) in T20s at Merchant Taylors' School Ground, and spinners 34%.
Captains winning the toss in T20s at Merchant Taylors' School Ground chose to field 64% of the time, and the toss winner went on to win 36% of matches.
Stephen Eskinazi has scored the most T20 runs at Merchant Taylors' School Ground: 241 in 5 innings, averaging 48.2.
Tom Helm has taken the most T20 wickets at Merchant Taylors' School Ground: 7 in 8 innings at an economy of 9.8.
Counted from UC Cricket's own ball-by-ball records; rebuilt nightly. Weather refreshes every few minutes.
