Providence · Capacity 20,000 · Opened 2006 · 174 matches on record
T20I Evenly balanced between batting first and chasing at Providence Stadium, based on 28 decided matches.
| Format | M | Avg 1st | Avg 2nd | Bat 1st won | Chased | Highest | Lowest | Top chase | Low defended | RR | Bdry % |
|---|---|---|---|---|---|---|---|---|---|---|---|
| T20I | 31 | 128 | 97 | 16 | 12 | 194 | 14 | 169 | 50 | 6.68 | 50.4 |
| ODI | 28 | 212 | 192 | 13 | 14 | 309 | 54 | 309 | 189 | 4.64 | 41.6 |
| Test | 3 | 287 | 195 | 3 | 0 | 476 | 144 | — | 160 | 2.86 | 43.5 |
| T20 | 97 | 153 | 136 | 39 | 46 | 226 | 64 | 195 | 125 | 7.63 | 59.6 |
| First-class | 4 | 297 | 325 | 0 | 3 | 382 | 28 | 382 | — | 3.51 | — |
Last first innings: 171/7, 173/5, 77/10, 136/8, 159/5
| Phase | Run rate | Wkts |
|---|---|---|
| powerplay | 6.47 | 103 |
| middle | 6.13 | 139 |
| death | 8.16 | 129 |
Based on 31 matches.
Last first innings: 140/10, 138/10, 267/10, 178/10, 108/10
| Phase | Run rate | Wkts |
|---|---|---|
| powerplay | 4.22 | 70 |
| middle | 4.34 | 221 |
| death | 6.71 | 116 |
Based on 28 matches.
Last first innings: 160/10, 226/10, 476/8
| Phase | Run rate | Wkts |
|---|---|---|
| first | 2.96 | 38 |
| middle | 2.79 | 50 |
| late | 2.82 | 27 |
Based on 3 matches.
Last first innings: 126/8, 119/10, 182/5, 128/10, 159/7
| Phase | Run rate | Wkts |
|---|---|---|
| powerplay | 7.29 | 296 |
| middle | 6.94 | 481 |
| death | 9.84 | 399 |
Based on 97 matches.
Last first innings: 213/10, 253/10, 375/9, 346/10
Based on 4 matches.
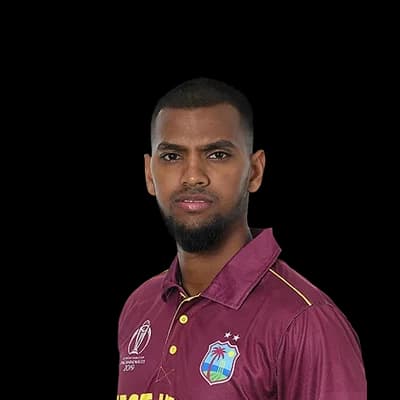 Nicholas Pooran289
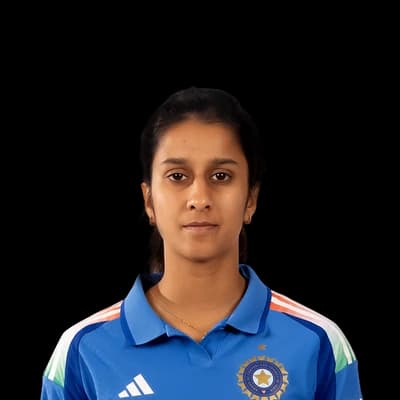 Jemimah Rodrigues195
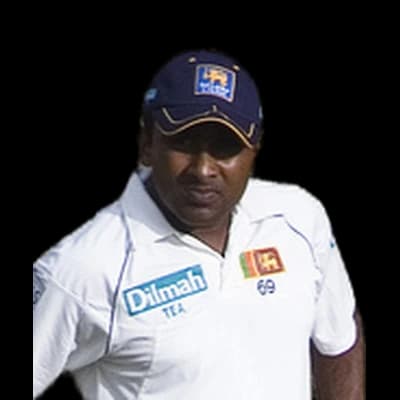 Mahela Jayawardene181
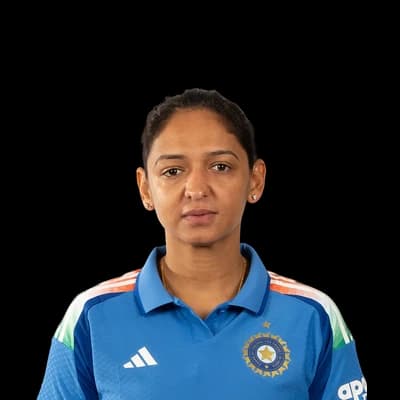 Harmanpreet Kaur180
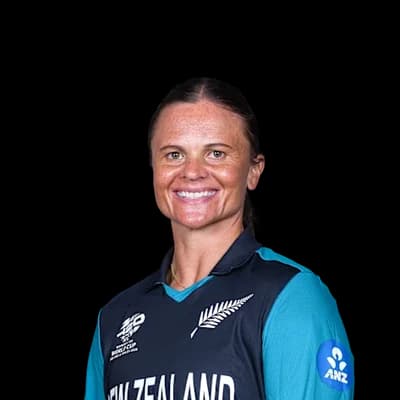 Suzie Bates161
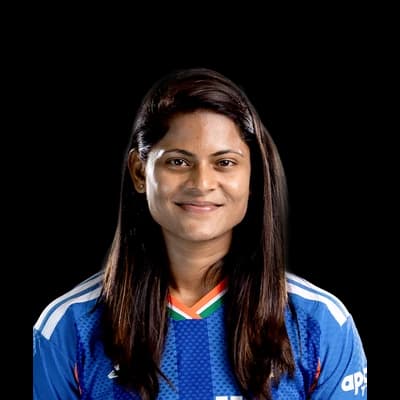 Radha Yadav11
 Poonam Yadav10
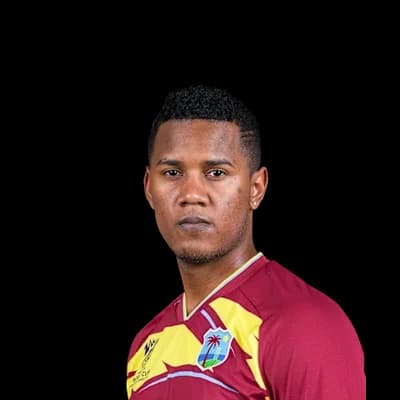 Akeal Hosein8
 Anuja Patil8
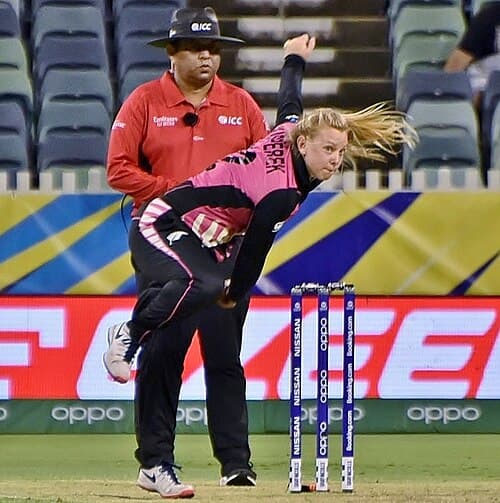 Leigh Kasperek8
 Tamim Iqbal339
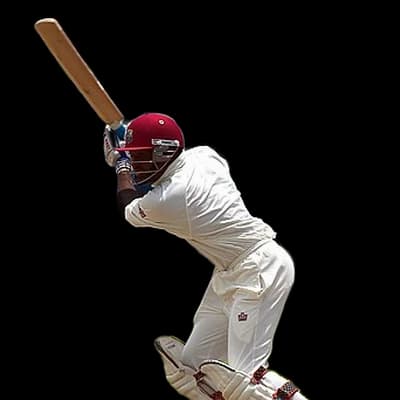 Shivnarine Chanderpaul314
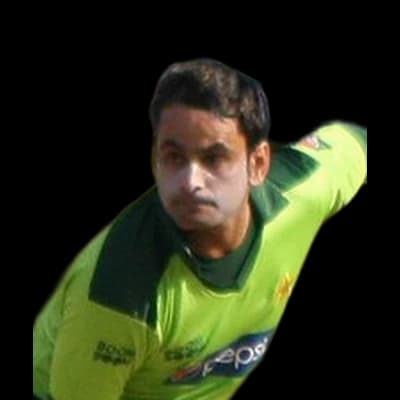 Mohammad Hafeez277
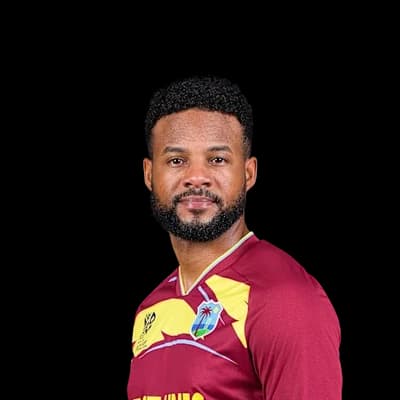 Shai Hope269
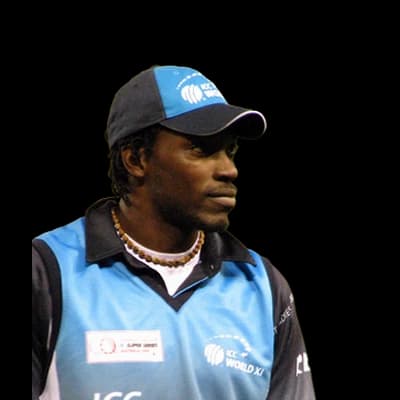 Chris Gayle252
 Sunil Narine12
 Dwayne Bravo11
 Jayden Lennox10
 Jason Holder10
 Shahid Afridi9
 Ramnaresh Sarwan186
 Malinda Warnapura182Mahela Jayawardene169Dwayne Bravo91Shivnarine Chanderpaul89
 Saeed Ajmal11
 Jayden Seales9
 Chaminda Vaas8
 Daren Sammy7
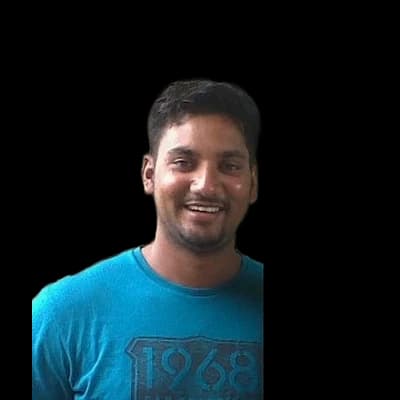 Ravi Rampaul7Shai Hope1244
 Shimron Hetmyer1092Nicholas Pooran622
 Rahmanullah Gurbaz578
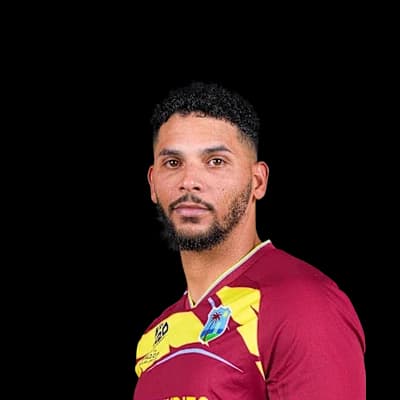 Brandon King520
 Imran Tahir66
 Dwaine Pretorius46
 Romario Shepherd41
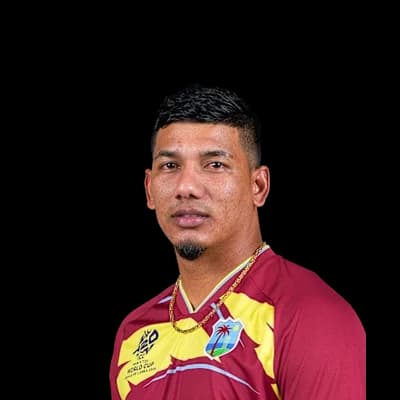 Gudakesh Motie37Sunil Narine27
Photos: ICC, BCCI, Hashir Milhan from Colombo, Sri Lanka, CC BY 2.0, via Wikimedia Commons, President's Secretariat, GODL-India, via Wikimedia Commons, Bahnfrend, CC BY-SA 4.0, via Wikimedia Commons, Cricfrenzy Tube, CC BY 3.0, via Wikimedia Commons, Ukexpat, CC BY-SA 3.0, via Wikimedia Commons, Harrias, CC BY-SA 3.0, via Wikimedia Commons, Dannow at English Wikipedia, Public domain, via Wikimedia Commons, IPL, Helenabella, CC BY-SA 3.0, via Wikimedia Commons, Shehbaz Sharif, CC BY 2.0, via Wikimedia Commons, BIFF Cricket TV, CC BY 3.0, via Wikimedia Commons, BeingFaridKhan, CC BY-SA 3.0, via Wikimedia Commons, Sampath_s, CC BY-SA 3.0, via Wikimedia Commons, paddynapper, CC BY-SA 2.0, via Wikimedia Commons, The Madras, CC BY-SA 3.0, via Wikimedia Commons
28°C
overcast
Feels 34°C · Humidity 83% · Wind 7 km/h · Cloud 99%
Rain outlook: no rain expected
Dew: likely – Heavy dew is likely from about 03:00; the side bowling second may find the ball wet.
| Month | High | Low | Rain mm | Rain days |
|---|---|---|---|---|
| January | 28° | 24° | 142 | 23.1 |
| February | 28° | 25° | 114.2 | 20.9 |
| March | 29° | 25° | 118.1 | 20.2 |
| April | 29° | 25° | 166.8 | 22.5 |
| May | 29° | 25° | 353.5 | 29.7 |
| June | 29° | 24° | 366.1 | 29.3 |
| July | 29° | 24° | 302.4 | 29.5 |
| August | 30° | 25° | 184.9 | 25.3 |
| September | 31° | 26° | 121.5 | 20.1 |
| October | 30° | 26° | 141.9 | 20 |
| November | 29° | 25° | 205.9 | 23.1 |
| December | 28° | 25° | 265.2 | 27.2 |
| Team | Format | P | W | L | Win % | Avg | Highest |
|---|---|---|---|---|---|---|---|
| Guyana Amazon Warriors | T20 | 68 | 39 | 19 | 57% | 149 | 226 |
| West Indies | ODI | 22 | 8 | 13 | 36% | 192 | 309 |
| Trinbago Knight Riders | T20 | 18 | 8 | 10 | 44% | 151 | 211 |
| Jamaica Tallawahs | T20 | 16 | 10 | 6 | 62% | 151 | 226 |
| St Lucia Kings | T20 | 14 | 5 | 9 | 36% | 145 | 198 |
| Barbados Royals | T20 | 11 | 3 | 8 | 27% | 139 | 195 |
| West Indies | T20I | 11 | 6 | 3 | 55% | 121 | 173 |
| St Kitts and Nevis Patriots | T20 | 10 | 3 | 7 | 30% | 140 | 193 |
Trinbago Knight Riders 126/8 (20.0) · Guyana Amazon Warriors 127/4 (18.4)
St Lucia Kings 119/10 (18.5) · Guyana Amazon Warriors 122/6 (18.3)
Antigua and Barbuda Falcons 182/5 (20.0) · Guyana Amazon Warriors 117/10 (14.2)
St Kitts and Nevis Patriots 128/10 (19.2) · Guyana Amazon Warriors 132/3 (18.3)
Jamaica Kingsmen 159/7 (20.0) · Guyana Amazon Warriors 160/2 (17.2)
Guyana Amazon Warriors 85/10 (18.5) · San Francisco Unicorns 79/10 (18.3)
GAW won by 6 runs
Desert Vipers 122/7 (20.0) · San Francisco Unicorns 126/2 (16.1)
SFU won by 8 wickets
Lahore Qalandars 152/6 (20.0) · San Francisco Unicorns 156/3 (15.2)
SFU won by 7 wickets
Perth Scorchers 135/10 (20.0) · Guyana Amazon Warriors 121/10 (16.1)
PS won by 14 runs
The average first-innings score at Providence Stadium in T20Is is 128, across 31 matches in our records. The par score (middle of the last 10 first innings) is 157.
In T20Is at Providence Stadium, sides batting first have won 57% of decided matches (16) and chasing sides 43% (12). Evenly balanced between batting first and chasing.
The highest T20I total at Providence Stadium is 194, and the lowest is 14.
The highest successful T20I chase at Providence Stadium is 169. The lowest total defended is 50.
Pace bowlers have taken 48% of the wickets (with a known bowling type) in T20Is at Providence Stadium, and spinners 52%.
Captains winning the toss in T20Is at Providence Stadium chose to field 45% of the time, and the toss winner went on to win 54% of matches.
Nicholas Pooran has scored the most T20I runs at Providence Stadium: 289 in 7 innings, averaging 57.8.
Radha Yadav has taken the most T20I wickets at Providence Stadium: 11 in 7 innings at an economy of 4.58.
Counted from UC Cricket's own ball-by-ball records; rebuilt nightly. Weather refreshes every few minutes.
