
The Spitfire Ground – Pitch Report, Records & Stats
Canterbury, England · 225 matches on record
T20 Evenly balanced between batting first and chasing at The Spitfire Ground, based on 90 decided matches.
The Spitfire Ground pitch report
T20I · 6 matches
- In 6 T20Is here, the side batting first has averaged 152; the highest total is 170.
- Chasing sides have won 50% of decided matches, so neither side has the edge.
- The highest successful chase is 150.
- Captains winning the toss chose to field 67% of the time.
- Scoring is quickest in the death overs at 8.7 an over.
ODI · 7 matches
- In 7 ODIs here, the side batting first has averaged 279; the highest total is 347.
- Chasing sides have won 29% of decided matches, so batting first is the better bet.
- The highest successful chase is 254.
- Captains winning the toss chose to field 83% of the time.
- Pace bowlers have taken 75% of the wickets here.
- Scoring is quickest in the death overs at 8.1 an over.
T20 · 94 matches
- In 94 T20s here, the side batting first has averaged 170; the highest total is 250.
- Chasing sides have won 46% of decided matches, so neither side has the edge.
- The highest successful chase is 200.
- Captains winning the toss chose to field 55% of the time.
- Pace bowlers have taken 68% of the wickets here.
- Scoring is quickest in the death overs at 9.6 an over.
List A · 34 matches
- In 34 List A matches here, the side batting first has averaged 255; the highest total is 404.
- Chasing sides have won 59% of decided matches, so chasing is the better bet.
- The highest successful chase is 332.
- Captains winning the toss chose to field 68% of the time.
- Pace bowlers have taken 67% of the wickets here.
- Scoring is quickest in the death overs at 7.3 an over.
First-class · 83 matches
- In 83 first-class matches here, the side batting first has averaged 325; the highest total is 722.
- Sides batting first have won 55% of the matches with a result.
- Captains winning the toss chose to field 52% of the time.
- Pace bowlers have taken 82% of the wickets here.
- Scoring is quickest in the late overs at 3.8 an over.
Records by format
| Format | M | Avg 1st | Avg 2nd | Bat 1st won | Chased | Highest | Lowest | Top chase | Low defended | RR | Bdry % |
|---|---|---|---|---|---|---|---|---|---|---|---|
| T20I | 6 | 152 | 143 | 3 | 3 | 170 | 104 | 150 | 137 | 7.61 | 54 |
| ODI | 7 | 279 | 195 | 5 | 2 | 347 | 75 | 254 | 256 | 5.07 | 48.8 |
| Test | 1 | 274 | 168 | 1 | 0 | 274 | 101 | — | 274 | 2.32 | 50.4 |
| T20 | 94 | 170 | 153 | 49 | 41 | 250 | 52 | 200 | 104 | 8.55 | 56.4 |
| List A | 34 | 255 | 220 | 14 | 20 | 404 | 50 | 332 | 200 | 5.46 | 46.5 |
| First-class | 83 | 325 | 306 | 27 | 22 | 722 | 4 | 564 | 133 | 3.45 | 55.6 |
Par score & toss impact
T20I
- Par score
- 146
- Toss winner won
- 83%
- Chose to field
- 67%
- Bat-first won
- 50%
Last first innings: 170/5, 170/5, 146/7, 146/7, 141/8
| Phase | Run rate | Wkts |
|---|---|---|
| powerplay | 6.58 | 13 |
| middle | 7.19 | 15 |
| death | 8.71 | 17 |
Based on 6 matches.
ODI
- Par score
- 269
- Toss winner won
- 17%
- Chose to field
- 83%
- Bat-first won
- 71%
Last first innings: 333/5, 347/5, 269/7, 228/10, 250/8
| Phase | Run rate | Wkts |
|---|---|---|
| powerplay | 4.25 | 21 |
| middle | 4.80 | 44 |
| death | 8.06 | 21 |
Based on 7 matches.
T20
- Par score
- 172
- Toss winner won
- 45%
- Chose to field
- 55%
- Bat-first won
- 54%
Last first innings: 172/6, 102/10, 176/6, 104/10, 184/7
| Phase | Run rate | Wkts |
|---|---|---|
| powerplay | 8.75 | 228 |
| middle | 8.13 | 445 |
| death | 9.64 | 362 |
Based on 94 matches.
List A
- Par score
- 287
- Toss winner won
- 59%
- Chose to field
- 68%
- Bat-first won
- 41%
Last first innings: 313/9, 253/10, 404/5, 301/9, 269/9
| Phase | Run rate | Wkts |
|---|---|---|
| powerplay | 4.92 | 74 |
| middle | 5.29 | 266 |
| death | 7.34 | 138 |
Based on 34 matches.
First-class
- Par score
- 416
- Toss winner won
- 60%
- Chose to field
- 52%
- Bat-first won
- 55%
Last first innings: 228/10, 161/10, 238/10, 416/10, 352/10
| Phase | Run rate | Wkts |
|---|---|---|
| first | 3.25 | 752 |
| middle | 3.43 | 808 |
| late | 3.82 | 574 |
Based on 83 matches.
Top players at The Spitfire Ground
T20I
- Most runs
 Sophie Devine145
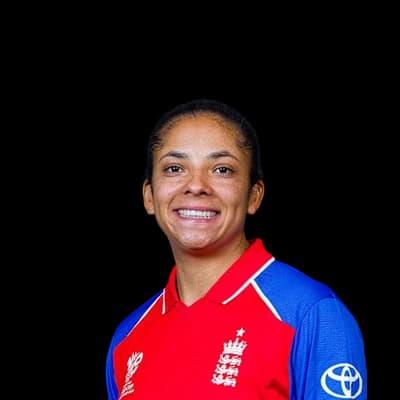 Sophia Dunkley142
 Hayley Matthews100
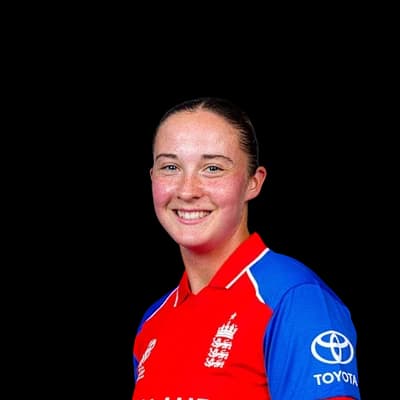 Alice Capsey89
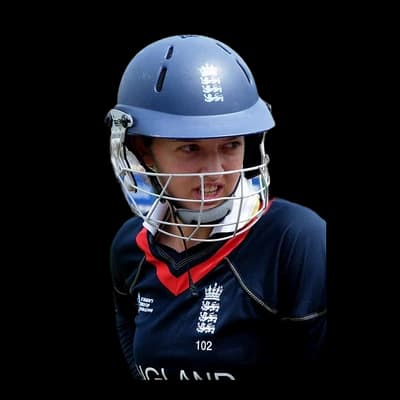 Sarah Taylor69
- Most wickets
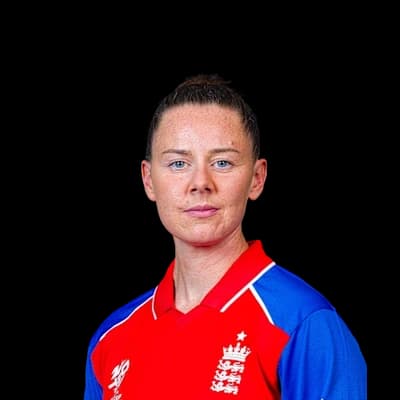 Linsey Smith4
 Sophie Ecclestone4
 Lauren Bell3
 Lauren Filer2
 Katherine Brunt2
ODI
- Most runs
 Tammy Beaumont217
 Harmanpreet Kaur143
 Jacques Kallis125
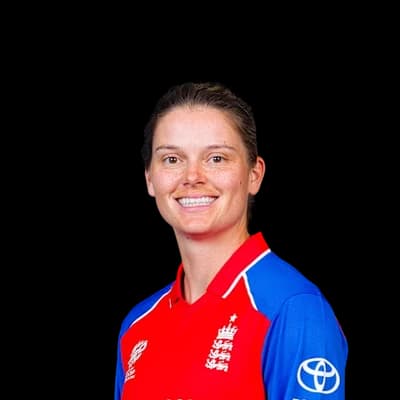 Amy Jones123
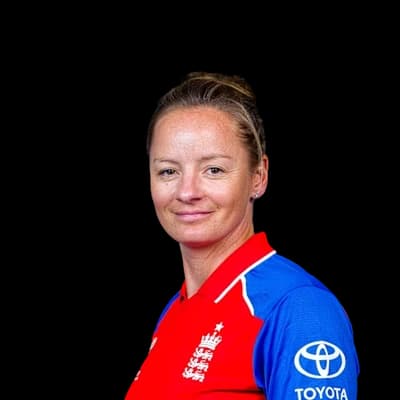 Danielle Wyatt Hodge109
- Most wickets
 Ellyse Perry7
 Kate Cross5
- Sophie Ecclestone5
 Renuka Thakur4
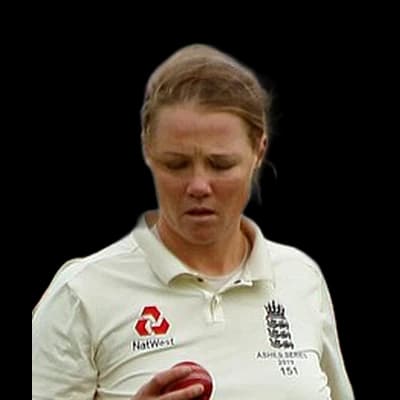 Anya Shrubsole3
Test
- Most runs
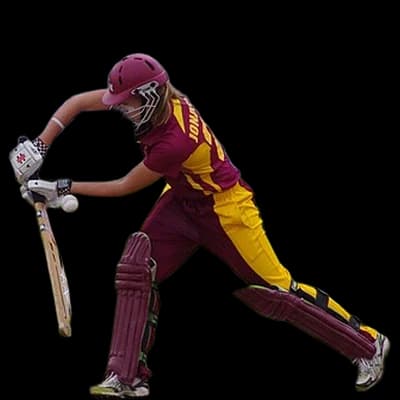 Jess Jonassen153
 Georgia Elwiss63
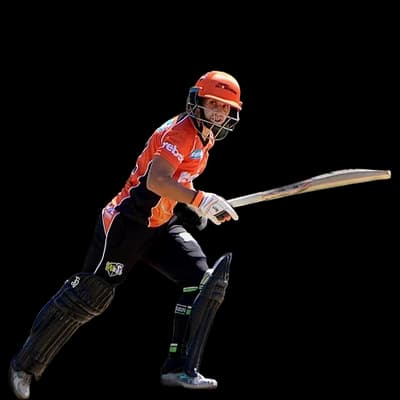 Nicole Bolton61
 Alex Blackwell54
 Alyssa Healy48
- Most wickets
- Ellyse Perry9
 Megan Schutt6
- Anya Shrubsole5
- Katherine Brunt4
 Sarah Coyte4
T20
- Most runs
 Daniel Bell-Drummond2041
 Joe Denly1739
 Sam Billings1694
 Sam Northeast922
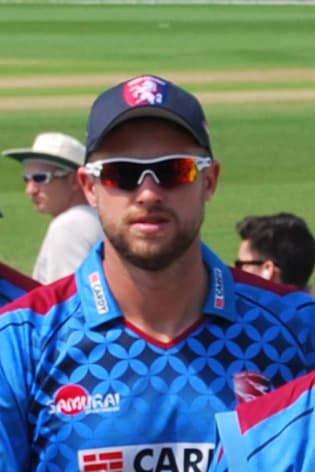 Alex Blake740
- Most wickets
 Grant Stewart36
 Fred Klaassen36
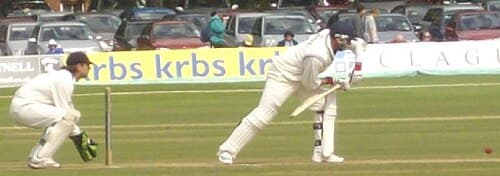 Darren Stevens34
 Mitchell Claydon26
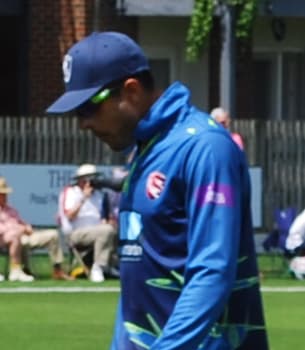 Imran Qayyum24
Photos: ICC, paddynapper, CC BY-SA 2.0, via Wikimedia Commons, BCCI, Kolkata Knight Riders - Official, CC BY 3.0, via Wikimedia Commons, Harrias, CC BY-SA 4.0, via Wikimedia Commons, Cricket Australia, Bahnfrend, CC BY-SA 4.0, via Wikimedia Commons, YellowMonkey, CC BY-SA 3.0, via Wikimedia Commons, Blue Square Thing, CC0, via Wikimedia Commons, Harrias, CC BY-SA 3.0, via Wikimedia Commons, Blue Square Thing, CC BY-SA 4.0, via Wikimedia Commons, AMBerry, CC BY-SA 3.0, via Wikimedia Commons
Weather at The Spitfire Ground
4°C
partly cloudy
Feels 1°C · Humidity 90% · Wind 8.3 km/h · Cloud 71%
Rain outlook: no rain expected
Dew: likely – Heavy dew is likely from about 01:00; the side bowling second may find the ball wet.
| Month | High | Low | Rain mm | Rain days |
|---|---|---|---|---|
| January | 7° | 2° | 72.3 | 12.5 |
| February | 9° | 4° | 60.9 | 12.2 |
| March | 11° | 4° | 60.8 | 12.8 |
| April | 13° | 6° | 44 | 9.5 |
| May | 17° | 9° | 57.2 | 10.5 |
| June | 20° | 12° | 61 | 9.9 |
| July | 23° | 14° | 57.2 | 11.8 |
| August | 22° | 14° | 61.8 | 11.2 |
| September | 20° | 12° | 54.4 | 9.8 |
| October | 15° | 10° | 78.7 | 12.4 |
| November | 11° | 6° | 75.8 | 13 |
| December | 9° | 4° | 75.9 | 12.9 |
Team records at The Spitfire Ground
| Team | Format | P | W | L | Win % | Avg | Highest |
|---|---|---|---|---|---|---|---|
| Kent | T20 | 86 | 36 | 47 | 42% | 162 | 236 |
| Kent | First-class | 82 | 23 | 26 | 28% | 258 | 585 |
| Kent | List A | 31 | 17 | 14 | 55% | 237 | 347 |
| Essex | T20 | 13 | 7 | 6 | 54% | 167 | 193 |
| Sussex | T20 | 13 | 7 | 5 | 54% | 173 | 228 |
| Surrey | T20 | 12 | 7 | 4 | 58% | 167 | 250 |
| Middlesex | T20 | 11 | 6 | 5 | 55% | 172 | 210 |
| Somerset | T20 | 11 | 4 | 7 | 36% | 162 | 226 |
Recent matches at The Spitfire Ground
- County Championship Division Two 202624 Sept 2026 · First-class
Gloucestershire 228/10 (69.5) · Kent 344/10 (92.4) · Gloucestershire 241/10 (75.1) · Kent 120/2 (26.3)
KEN won by 8 wickets
- County Championship 202615 Sept 2026 · First-class
Lancashire 161/10 (58.5) · Kent 214/10 (51.3) · Lancashire 192/10 (58.3) · Kent 142/3 (34.3)
- County Championship 20262 Sept 2026 · First-class
Kent 238/10 (64.2) · Worcestershire 217/10 (59.0) · Kent 358/10 (108.3) · Worcestershire 295/10 (84.2)
The Spitfire Ground: frequently asked questions
What is the average first-innings score at The Spitfire Ground in T20s?
The average first-innings score at The Spitfire Ground in T20s is 170, across 94 matches in our records. The par score (middle of the last 10 first innings) is 172.
Is it better to bat first or chase at The Spitfire Ground?
In T20s at The Spitfire Ground, sides batting first have won 54% of decided matches (49) and chasing sides 46% (41). Evenly balanced between batting first and chasing.
What is the highest T20 total at The Spitfire Ground?
The highest T20 total at The Spitfire Ground is 250, and the lowest is 52.
What is the highest successful chase at The Spitfire Ground in T20s?
The highest successful T20 chase at The Spitfire Ground is 200. The lowest total defended is 104.
Does the pitch at The Spitfire Ground help pace or spin?
Pace bowlers have taken 68% of the wickets (with a known bowling type) in T20s at The Spitfire Ground, and spinners 32%.
What do captains choose after winning the toss at The Spitfire Ground?
Captains winning the toss in T20s at The Spitfire Ground chose to field 55% of the time, and the toss winner went on to win 45% of matches.
Who has scored the most T20 runs at The Spitfire Ground?
Daniel Bell-Drummond has scored the most T20 runs at The Spitfire Ground: 2041 in 71 innings, averaging 29.6.
Who has taken the most T20 wickets at The Spitfire Ground?
Grant Stewart has taken the most T20 wickets at The Spitfire Ground: 36 in 34 innings at an economy of 9.05.
More grounds in England
View all →Counted from UC Cricket's own ball-by-ball records; rebuilt nightly. Weather refreshes every few minutes.