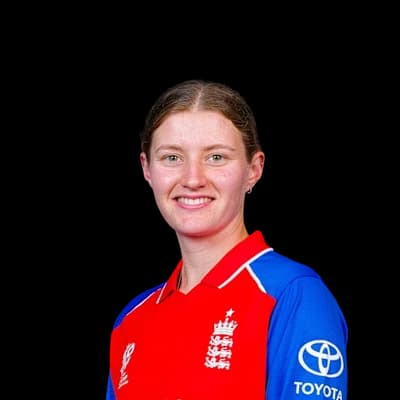
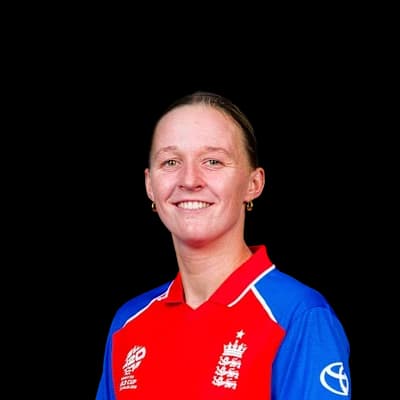
Northampton, England · 254 matches on record
T20 Evenly balanced between batting first and chasing at County Ground, based on 96 decided matches.
| Format | M | Avg 1st | Avg 2nd | Bat 1st won | Chased | Highest | Lowest | Top chase | Low defended | RR | Bdry % |
|---|---|---|---|---|---|---|---|---|---|---|---|
| T20I | 5 | 149 | 93 | 5 | 0 | 180 | 54 | — | 103 | 6.63 | 51.1 |
| ODI | 2 | 162 | 219 | 0 | 1 | 219 | 106 | 219 | — | 4.91 | 57.1 |
| T20 | 101 | 170 | 155 | 51 | 45 | 238 | 69 | 219 | 139 | 8.51 | 59.3 |
| List A | 59 | 252 | 230 | 21 | 34 | 415 | 12 | 344 | 161 | 5.55 | 48.7 |
| First-class | 86 | 303 | 311 | 33 | 17 | 640 | 10 | 435 | 101 | 3.48 | 54.5 |
Last first innings: 144/6, 177/7, 180/6, 141/3, 103/7
| Phase | Run rate | Wkts |
|---|---|---|
| powerplay | 6.92 | 12 |
| middle | 5.84 | 28 |
| death | 7.86 | 31 |
Based on 5 matches.
Last first innings: 152/10, 153/10, 223/4, 144/4, 238/6
| Phase | Run rate | Wkts |
|---|---|---|
| powerplay | 8.28 | 296 |
| middle | 8.15 | 453 |
| death | 9.81 | 392 |
Based on 101 matches.
Last first innings: 185/10, 347/6, 246/10, 312/9, 227/10
| Phase | Run rate | Wkts |
|---|---|---|
| powerplay | 4.96 | 140 |
| middle | 5.47 | 402 |
| death | 7.39 | 199 |
Based on 59 matches.
Last first innings: 370/10, 205/10, 345/10, 465/10, 306/10
| Phase | Run rate | Wkts |
|---|---|---|
| first | 3.26 | 958 |
| middle | 3.51 | 1015 |
| late | 3.79 | 662 |
Based on 86 matches.
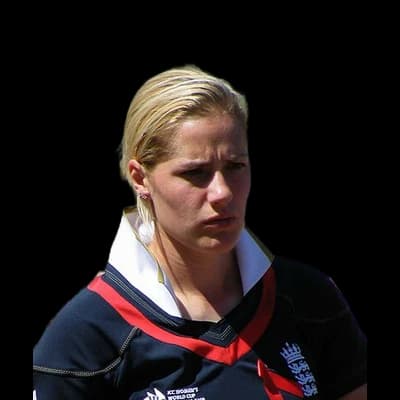
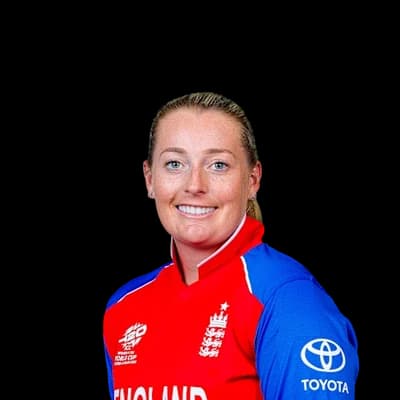
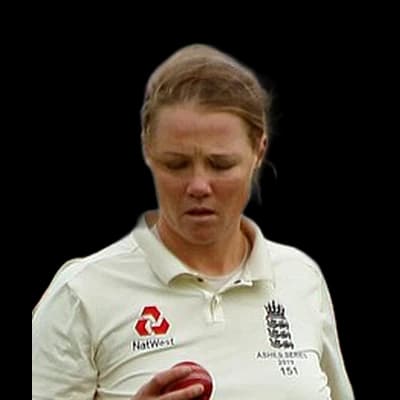
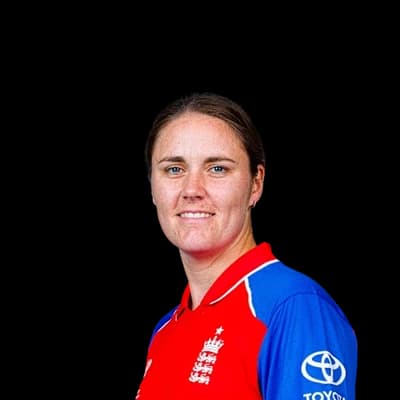 Natalie Sciver131
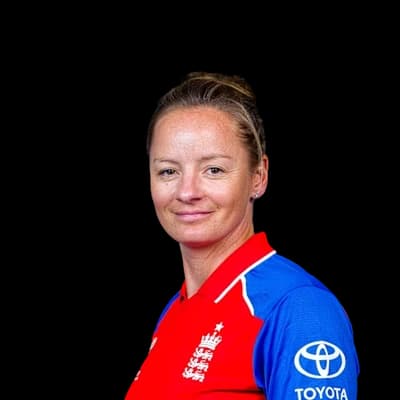 Danielle Wyatt Hodge123
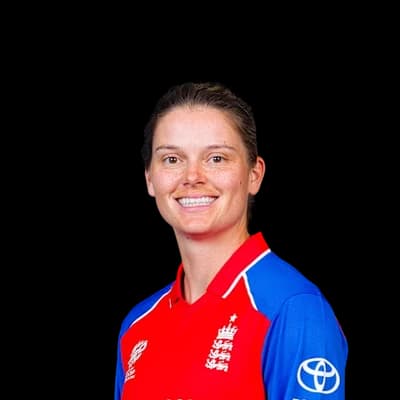 Amy Jones95
 Charlotte Edwards92
 Stacy-Ann King51
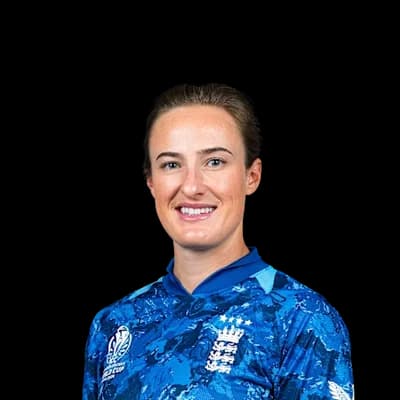 Emma Lamb102
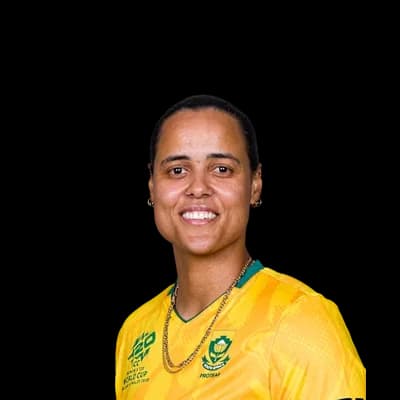 Chloe Tryon88Natalie Sciver55
 Laura Wolvaardt43
 Nadine de Klerk38
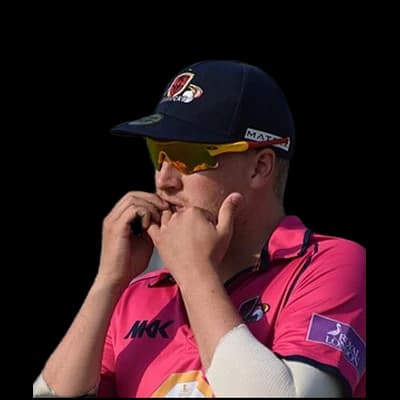 Josh Cobb1339
 Richard Levi1067
 David Willey1040
 Adam Rossington925
 Ricardo Vasconcelos925
 Ben Sanderson77David Willey47
 Graeme White43
 Rory Kleinveldt28
 Tom Taylor28
 Rob Keogh1030Ricardo Vasconcelos1008Josh Cobb765Richard Levi593Adam Rossington565Ben Sanderson33Graeme White28Rob Keogh21
 Nathan Buck18
 Luke Procter16
Photos: ICC, PaddyBriggs, Public domain, via Wikimedia Commons, paddynapper, CC BY-SA 2.0, via Wikimedia Commons, Harrias, CC BY-SA 4.0, via Wikimedia Commons, Ministry of Defence, GODL-India, via Wikimedia Commons, Charltonkyle, CC BY-SA 4.0, via Wikimedia Commons, Harrias, CC BY-SA 3.0, via Wikimedia Commons, Whatisthefrequencykenneth, CC BY 3.0, via Wikimedia Commons, Dave Morton, Public domain, via Wikimedia Commons, Stephen Turner at English Wikipedia, CC BY-SA 3.0, via Wikimedia Commons, Kyle Andrews, CC BY-SA 4.0, via Wikimedia Commons, Adocentyn, CC BY-SA 3.0, via Wikimedia Commons
9°C
overcast
Feels 6°C · Humidity 94% · Wind 15.5 km/h · Cloud 93%
Rain outlook: rain very likely to interrupt
Dew: likely – Heavy dew is likely from about 04:00; the side bowling second may find the ball wet.
| Team | Format | P | W | L | Win % | Avg | Highest |
|---|---|---|---|---|---|---|---|
| Northamptonshire | First-class | 85 | 24 | 26 | 28% | 266 | 605 |
| Northamptonshire | T20 | 85 | 42 | 40 | 49% | 167 | 238 |
| Northamptonshire | List A | 48 | 18 | 27 | 38% | 248 | 415 |
| Worcestershire | T20 | 13 | 7 | 6 | 54% | 171 | 211 |
| Derbyshire | T20 | 10 | 4 | 6 | 40% | 182 | 224 |
| Durham | T20 | 10 | 3 | 5 | 30% | 148 | 208 |
| Leicestershire | T20 | 10 | 3 | 6 | 30% | 173 | 219 |
| Birmingham Bears | T20 | 8 | 4 | 4 | 50% | 170 | 213 |
Derbyshire 370/10 (83.4) · Northamptonshire 308/10 (105.4) · Derbyshire 279/10 (77.2) · Northamptonshire 324/6 (89.4)
Match Drawn
Durham 205/10 (56.2) · Northamptonshire 263/10 (88.0) · Durham 261/10 (84.5) · Northamptonshire 50/10 (22.2)
Kent 345/10 (91.3) · Northamptonshire 450/6 (97.1)
draw
Somerset 185/10 (47.0) · Northamptonshire 189/3 (30.0)
Northamptonshire 347/6 (50.0) · Lancashire 280/10 (45.2)
Northamptonshire 246/10 (45.3) · Leicestershire 248/2 (38.5)
The average first-innings score at County Ground in T20s is 170, across 101 matches in our records. The par score (middle of the last 10 first innings) is 154.
In T20s at County Ground, sides batting first have won 53% of decided matches (51) and chasing sides 47% (45). Evenly balanced between batting first and chasing.
The highest T20 total at County Ground is 238, and the lowest is 69.
The highest successful T20 chase at County Ground is 219. The lowest total defended is 139.
Pace bowlers have taken 70% of the wickets (with a known bowling type) in T20s at County Ground, and spinners 30%.
Captains winning the toss in T20s at County Ground chose to field 56% of the time, and the toss winner went on to win 48% of matches.
Josh Cobb has scored the most T20 runs at County Ground: 1339 in 44 innings, averaging 32.7.
Ben Sanderson has taken the most T20 wickets at County Ground: 77 in 54 innings at an economy of 8.65.
Counted from UC Cricket's own ball-by-ball records; rebuilt nightly. Weather refreshes every few minutes.