Hyderabad, India · Capacity 39,200 · 125 matches on record
ODI Batting first has the edge at Rajiv Gandhi International Stadium, based on 10 decided matches.
| Format | M | Avg 1st | Avg 2nd | Bat 1st won | Chased | Highest | Lowest | Top chase | Low defended | RR | Bdry % |
|---|---|---|---|---|---|---|---|---|---|---|---|
| T20I | 4 | 234 | 196 | 1 | 2 | 297 | 164 | 209 | 297 | 10.89 | 69.5 |
| ODI | 10 | 297 | 261 | 6 | 4 | 350 | 174 | 345 | 286 | 5.83 | 51.6 |
| Test | 6 | 378 | 388 | 4 | 1 | 687 | 68 | 367 | 237 | 3.24 | 52.2 |
| T20 | 90 | 168 | 157 | 41 | 47 | 286 | 80 | 247 | 118 | 8.46 | 60 |
| First-class | 1 | 283 | 631 | 0 | 0 | 631 | 283 | — | — | 3.80 | — |
Last first innings: 247/3, 297/6, 186/7, 207/5
| Phase | Run rate | Wkts |
|---|---|---|
| powerplay | 11.08 | 14 |
| middle | 10.04 | 16 |
| death | 12.24 | 16 |
Based on 4 matches.
Last first innings: 344/9, 322/7, 286/10, 349/8, 236/7
| Phase | Run rate | Wkts |
|---|---|---|
| powerplay | 4.87 | 24 |
| middle | 5.64 | 82 |
| death | 7.70 | 49 |
Based on 10 matches.
Last first innings: 246/10, 311/10, 687/6, 237/9, 438/10
| Phase | Run rate | Wkts |
|---|---|---|
| first | 3.41 | 50 |
| middle | 3.11 | 64 |
| late | 3.23 | 73 |
Based on 6 matches.
Last first innings: 255/4, 235/4, 165/10, 242/2, 194/9
| Phase | Run rate | Wkts |
|---|---|---|
| powerplay | 8.23 | 251 |
| middle | 7.98 | 389 |
| death | 9.78 | 412 |
Based on 90 matches.
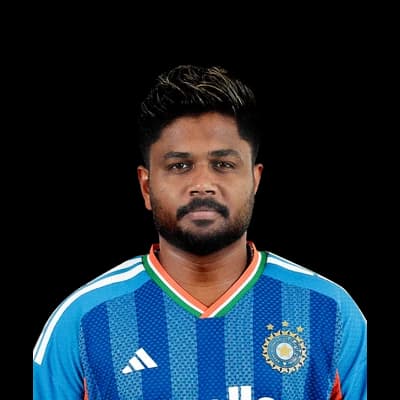 Sanju Samson167
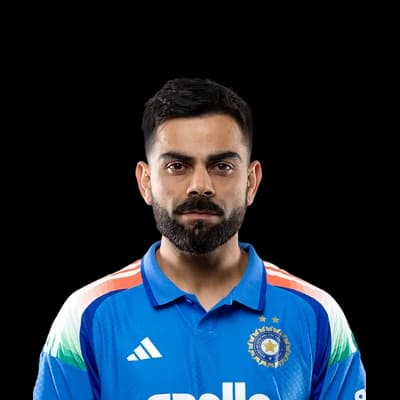 Virat Kohli157
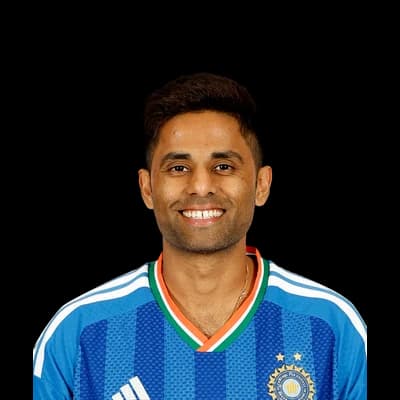 Surya Kumar Yadav144
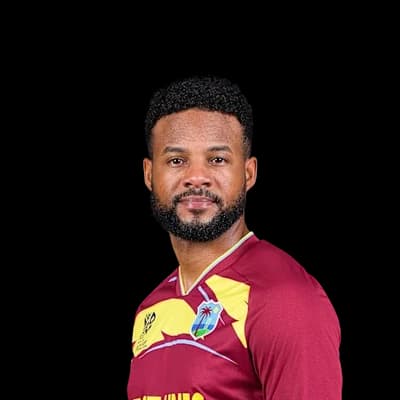 Shai Hope102
 Shimron Hetmyer89
 Keemo Paul5
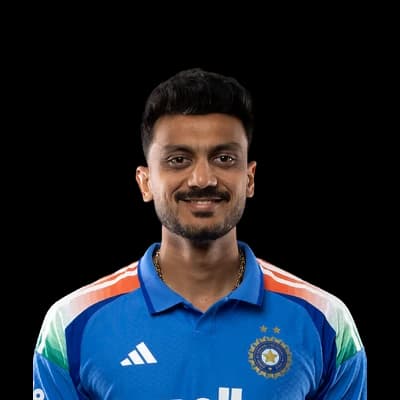 Axar Patel4
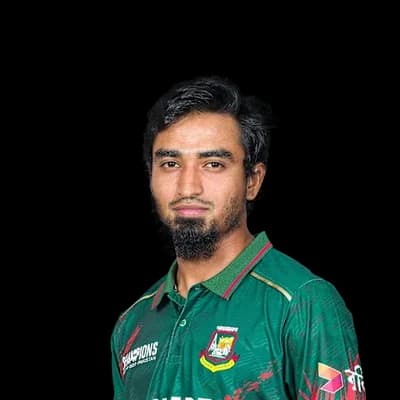 Tanzim Hasan Sakib3
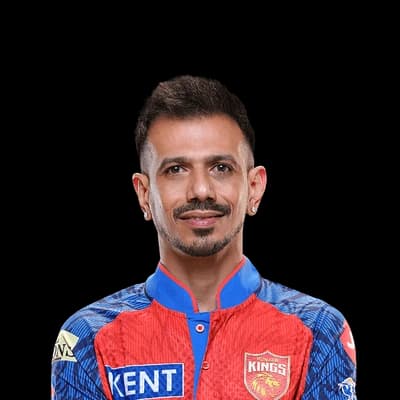 Yuzvendra Chahal3
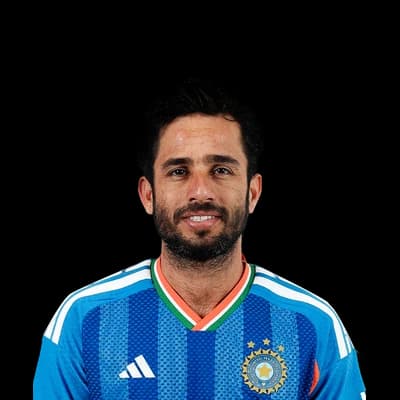 Ravi Bishnoi3
 Yuvraj Singh233
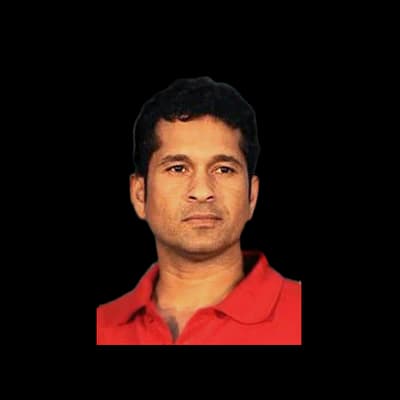 Sachin Tendulkar220
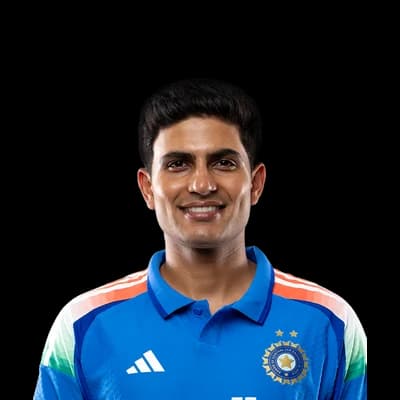 Shubman Gill208
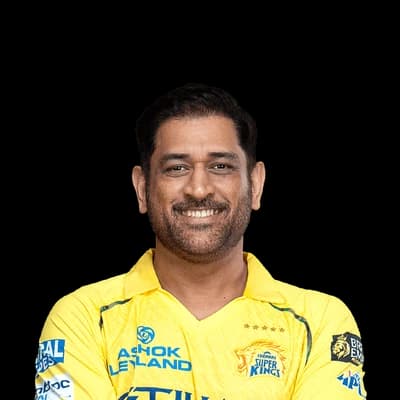 MS Dhoni202
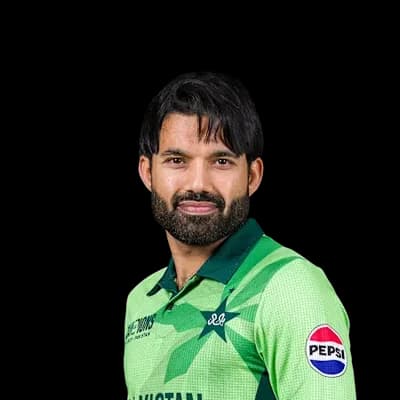 Mohammad Rizwan199
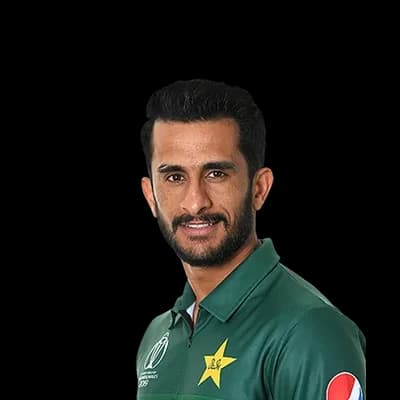 Hasan Ali6
 Umesh Yadav6
 Mitchell Santner6
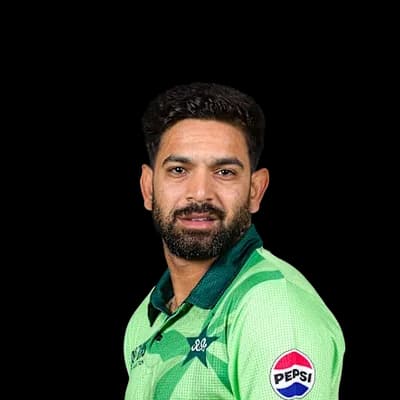 Haris Rauf5
 Bas de Leede5
 Cheteshwar Pujara510Virat Kohli379
 Brendon McCullum293
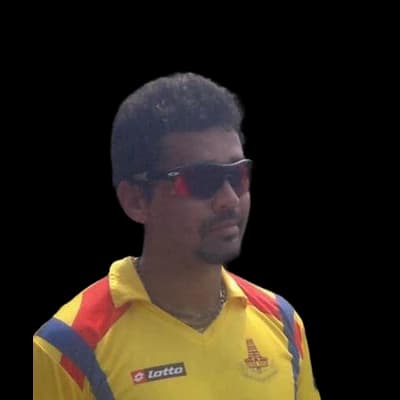 Murali Vijay282
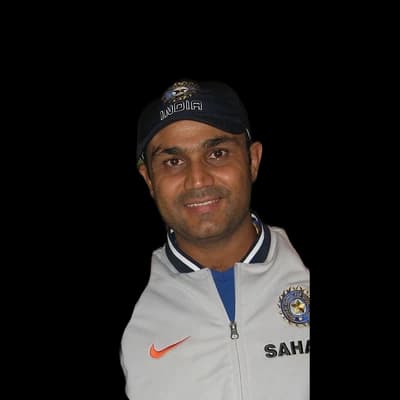 Virender Sehwag203
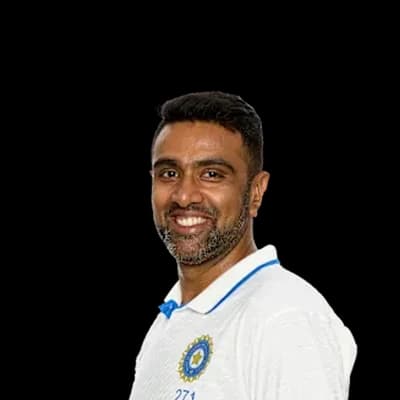 Ravichandran Ashwin33
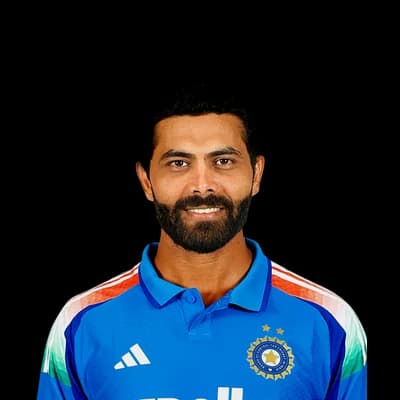 Ravindra Jadeja20Umesh Yadav15
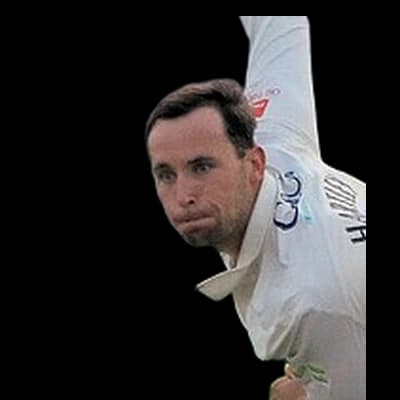 Tom Hartley9
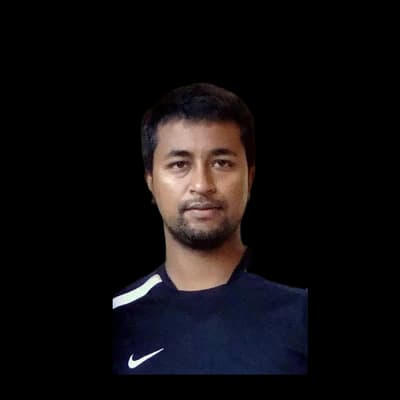 Pragyan Ojha9
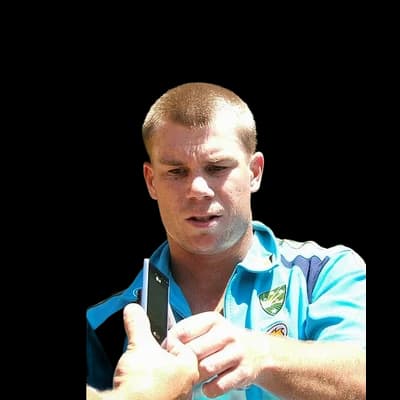 David Warner1623
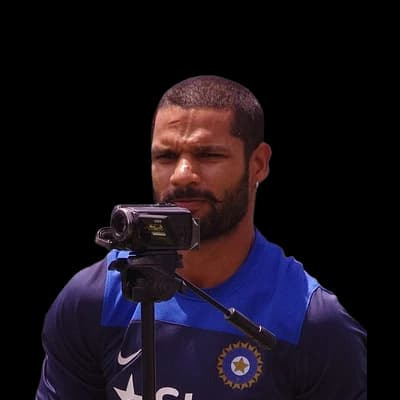 Shikhar Dhawan1477
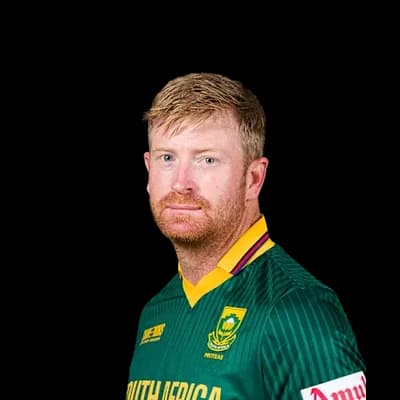 Heinrich Klaasen943
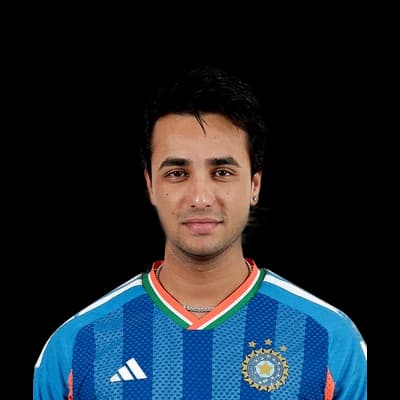 Abhishek Sharma821
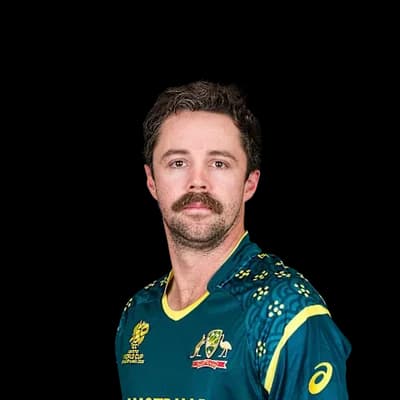 Travis Head669
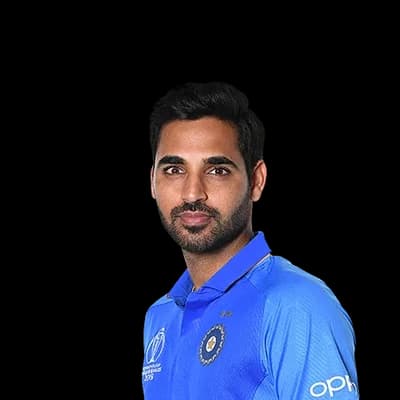 Bhuvneshwar Kumar48
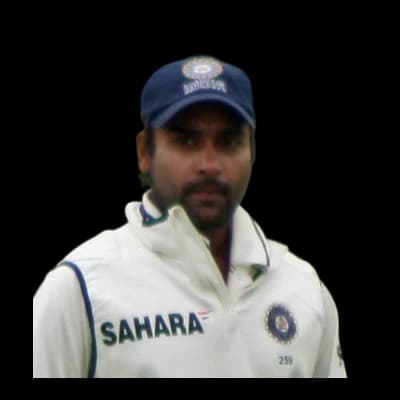 Amit Mishra30
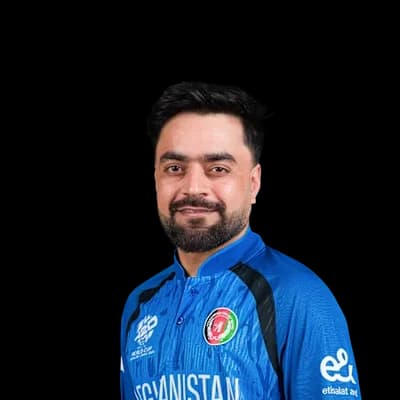 Rashid Khan28
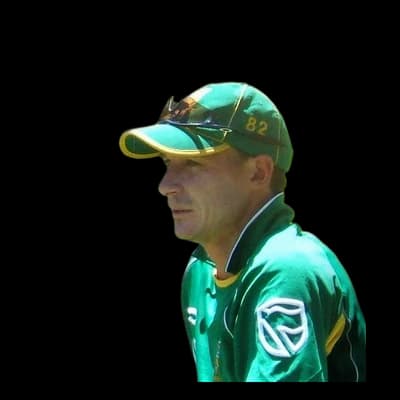 Dale Steyn27Siddarth Kaul21
Photos: BCCI, ICC, IPL, Bollywood Hungama, CC BY 3.0, via Wikimedia Commons, Dee03, CC BY-SA 3.0, via Wikimedia Commons, NAPARAZZI, CC BY-SA 2.0, via Wikimedia Commons, Ben Sutherland from Crystal Palace, London, UK, CC BY 2.0, via Wikimedia Commons, Flying Cloud, CC BY 2.0, via Wikimedia Commons, Dave Morton, Public domain, via Wikimedia Commons, YellowMonkey/Blnguyen, CC BY-SA 4.0, via Wikimedia Commons, Harrias, CC BY-SA 3.0, via Wikimedia Commons
29°C
overcast
Feels 31°C · Humidity 54% · Wind 4.1 km/h · Cloud 91%
Rain outlook: no rain expected
Dew: unlikely – No dew expected this evening.
| Month | High | Low | Rain mm | Rain days |
|---|---|---|---|---|
| January | 29° | 17° | 5.1 | 1.2 |
| February | 32° | 18° | 2.7 | 0.4 |
| March | 35° | 22° | 9 | 1.4 |
| April | 37° | 24° | 13.7 | 2.7 |
| May | 37° | 26° | 32.9 | 6.1 |
| June | 33° | 25° | 123.9 | 16.2 |
| July | 29° | 23° | 216.7 | 21.4 |
| August | 29° | 23° | 163.7 | 18.9 |
| September | 29° | 23° | 179.7 | 20.1 |
| October | 30° | 21° | 91.5 | 13.6 |
| November | 29° | 19° | 14.8 | 4.1 |
| December | 28° | 17° | 11.1 | 2.5 |
| Team | Format | P | W | L | Win % | Avg | Highest |
|---|---|---|---|---|---|---|---|
| Sunrisers Hyderabad | T20 | 70 | 42 | 26 | 60% | 167 | 286 |
| Deccan Chargers | T20 | 18 | 3 | 15 | 17% | 157 | 214 |
| Mumbai Indians | T20 | 14 | 9 | 5 | 64% | 156 | 246 |
| Royal Challengers Bangalore | T20 | 11 | 3 | 7 | 27% | 146 | 187 |
| Kings XI Punjab | T20 | 10 | 4 | 6 | 40% | 160 | 211 |
| Kolkata Knight Riders | T20 | 10 | 7 | 3 | 70% | 163 | 204 |
| Rajasthan Royals | T20 | 10 | 3 | 7 | 30% | 172 | 242 |
| Chennai Super Kings | T20 | 8 | 3 | 5 | 38% | 169 | 223 |
West Indies 247/3 (20.0) · India 223/10 (19.3)
The average first-innings score at Rajiv Gandhi International Stadium in ODIs is 297, across 10 matches in our records. The par score (middle of the last 10 first innings) is 300.
In ODIs at Rajiv Gandhi International Stadium, sides batting first have won 60% of decided matches (6) and chasing sides 40% (4). Batting first has the edge.
The highest ODI total at Rajiv Gandhi International Stadium is 350, and the lowest is 174.
The highest successful ODI chase at Rajiv Gandhi International Stadium is 345. The lowest total defended is 286.
Pace bowlers have taken 65% of the wickets (with a known bowling type) in ODIs at Rajiv Gandhi International Stadium, and spinners 35%.
Captains winning the toss in ODIs at Rajiv Gandhi International Stadium chose to field 30% of the time, and the toss winner went on to win 50% of matches.
Yuvraj Singh has scored the most ODI runs at Rajiv Gandhi International Stadium: 233 in 3 innings, averaging 77.7.
Hasan Ali has taken the most ODI wickets at Rajiv Gandhi International Stadium: 6 in 2 innings at an economy of 6.12.
Counted from UC Cricket's own ball-by-ball records; rebuilt nightly. Weather refreshes every few minutes.
