Delhi, India · Capacity 35,200 · Opened 1883 · 208 matches on record
T20I Chasing has the edge at Arun Jaitley Stadium, based on 9 decided matches.
| Format | M | Avg 1st | Avg 2nd | Bat 1st won | Chased | Highest | Lowest | Top chase | Low defended | RR | Bdry % |
|---|---|---|---|---|---|---|---|---|---|---|---|
| T20I | 13 | 174 | 148 | 3 | 6 | 221 | 94 | 212 | 202 | 8.60 | 64 |
| ODI | 8 | 326 | 240 | 6 | 2 | 428 | 90 | 282 | 272 | 6.66 | 59.4 |
| Test | 4 | 387 | 290 | 0 | 3 | 536 | 113 | 276 | — | 3.35 | 54.9 |
| T20 | 172 | 166 | 156 | 55 | 68 | 278 | 6 | 265 | 73 | 8.83 | 64.7 |
| First-class | 1 | 211 | 310 | 0 | 1 | 310 | 179 | 310 | — | 3.58 | — |
Last first innings: 221/7, 159/8, 156/8, 153/7, 122/6
| Phase | Run rate | Wkts |
|---|---|---|
| powerplay | 8.66 | 44 |
| middle | 7.94 | 66 |
| death | 10.01 | 52 |
Based on 13 matches.
Last first innings: 412/10, 412/10, 279/10, 399/8, 428/5
| Phase | Run rate | Wkts |
|---|---|---|
| powerplay | 5.92 | 22 |
| middle | 6.08 | 63 |
| death | 8.73 | 35 |
Based on 8 matches.
Last first innings: 518/5, 263/10, 536/7, 231/10
| Phase | Run rate | Wkts |
|---|---|---|
| first | 3.30 | 50 |
| middle | 3.40 | 34 |
| late | 3.34 | 40 |
Based on 4 matches.
Last first innings: 182/8, 218/5, 193/7, 179/10, 118/6
| Phase | Run rate | Wkts |
|---|---|---|
| powerplay | 9.03 | 389 |
| middle | 8.16 | 627 |
| death | 10.27 | 512 |
Based on 172 matches.
 Abhishek Sharma244
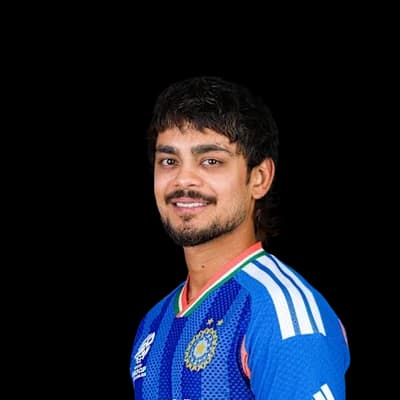 Ishan Kishan227
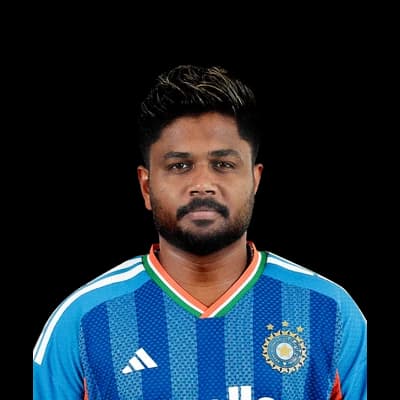 Sanju Samson149
 Azmatullah Omarzai132
 Ibrahim Zadran126
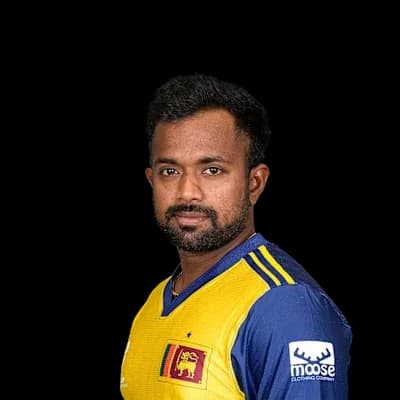 Charith Asalanka187
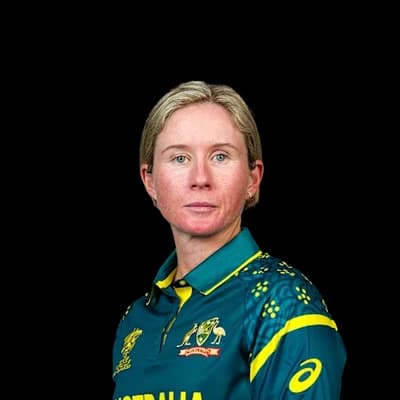 Beth Mooney138
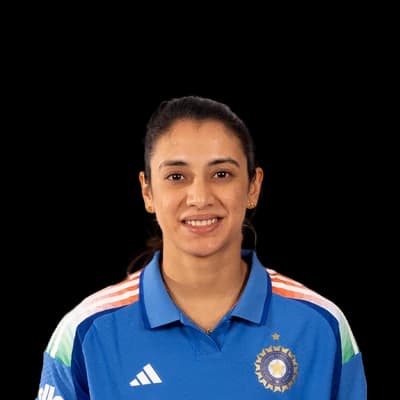 Smriti Mandhana125
 Aiden Markram115
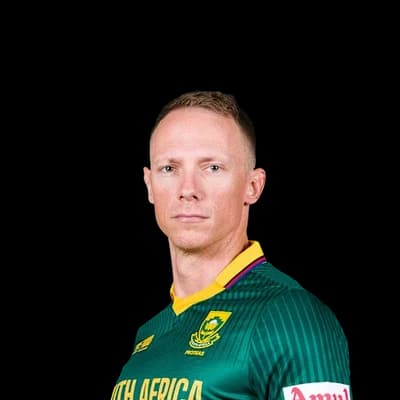 Rassie van der Dussen108
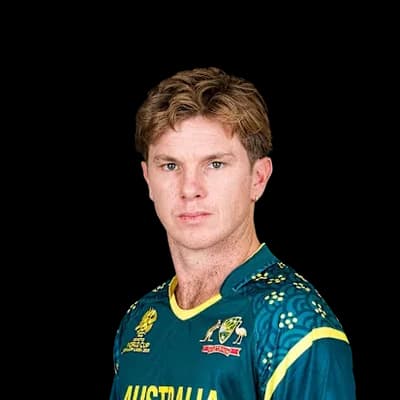 Adam Zampa7
 Kuldeep Yadav5
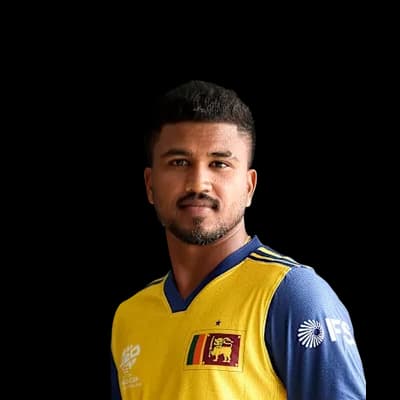 Dilshan Madushanka5
 Logan van Beek4
 Arshad Khan3
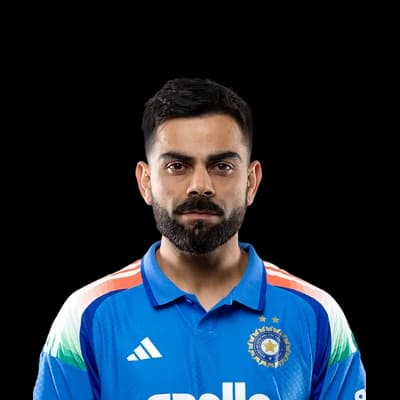 Virat Kohli357
 Dinesh Chandimal200
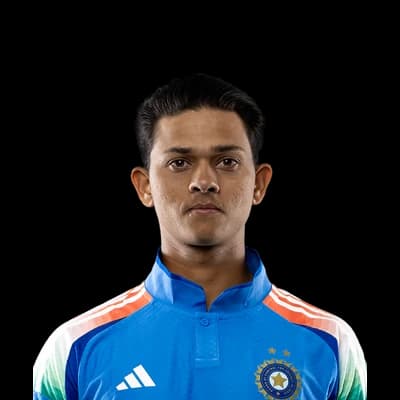 Yashasvi Jaiswal183
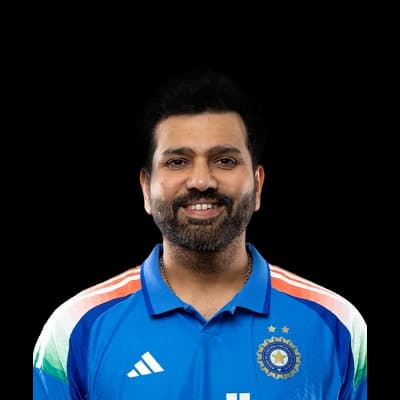 Rohit Sharma178
 Murali Vijay164
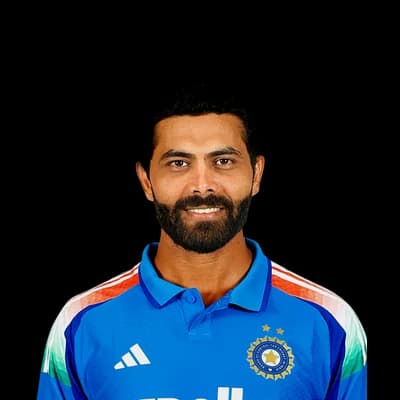 Ravindra Jadeja19
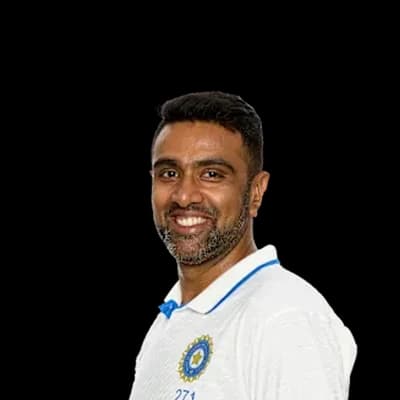 Ravichandran Ashwin10Kuldeep Yadav8
 Anil Kumble7
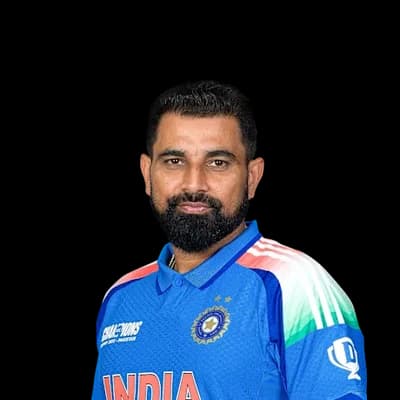 Mohammad Shami7
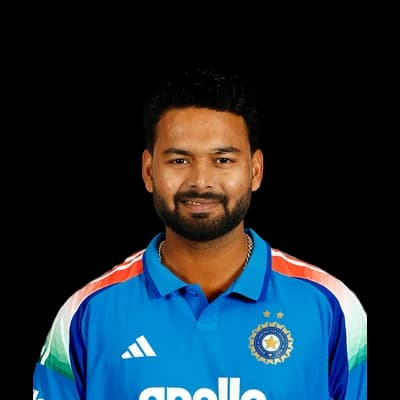 Rishabh Pant956
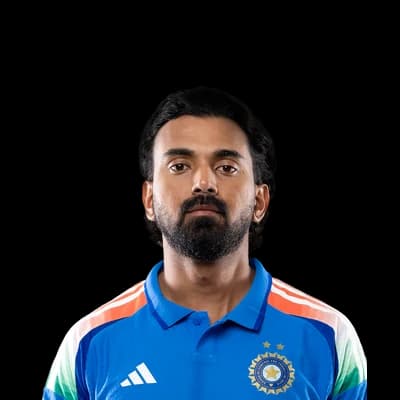 KL Rahul590
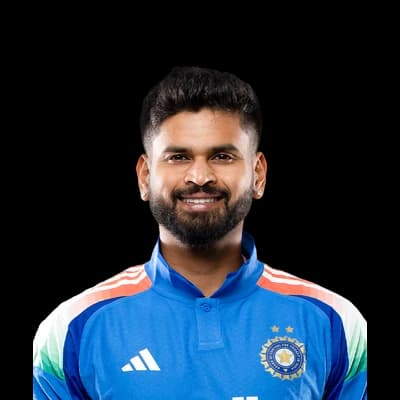 Shreyas Iyer563
 Sarthak Ranjan549
 Axar Patel525
 Gavnish Khurana24Axar Patel22Anshuman Hooda22
 Amit Mishra21Kuldeep Yadav20
Photos: BCCI, ICC, Dee03, CC BY-SA 3.0, via Wikimedia Commons, shrivsa from Bangalore, India, CC BY-SA 2.0, via Wikimedia Commons, IPL, Harrias, CC BY-SA 3.0, via Wikimedia Commons
24°C
clear
Feels 26°C · Humidity 65% · Wind 3.1 km/h · Cloud 0%
Rain outlook: no rain expected
Dew: likely – Heavy dew is likely from about 04:00; the side bowling second may find the ball wet.
| Month | High | Low | Rain mm | Rain days |
|---|---|---|---|---|
| January | 19° | 8° | 31.5 | 3.8 |
| February | 24° | 11° | 18.4 | 2.8 |
| March | 30° | 16° | 22.6 | 3.6 |
| April | 37° | 22° | 8.4 | 2.1 |
| May | 39° | 25° | 33.2 | 4.7 |
| June | 38° | 28° | 65.1 | 9 |
| July | 34° | 27° | 234.8 | 22.3 |
| August | 33° | 26° | 176.2 | 20.9 |
| September | 33° | 25° | 130.1 | 12.3 |
| October | 32° | 20° | 20.8 | 2.1 |
| November | 27° | 15° | 5.7 | 0.8 |
| December | 22° | 10° | 6.7 | 1 |
| Team | Format | P | W | L | Win % | Avg | Highest |
|---|---|---|---|---|---|---|---|
| Delhi Capitals | T20 | 31 | 11 | 18 | 35% | 175 | 264 |
| Central Delhi Kings | T20 | 25 | 8 | 3 | 32% | 172 | 232 |
| South Delhi Superstarz | T20 | 23 | 4 | 4 | 17% | 165 | 220 |
| West Delhi Lions | T20 | 23 | 7 | 3 | 30% | 163 | 214 |
| East Delhi Riders | T20 | 22 | 6 | 4 | 27% | 156 | 235 |
| Purani Delhi-6 | T20 | 22 | 2 | 7 | 9% | 160 | 211 |
| Outer Delhi Warriors | T20 | 21 | 2 | 6 | 10% | 154 | 231 |
| New Delhi Tigers | T20 | 20 | 5 | 5 | 25% | 157 | 222 |
India 221/7 (20.0) · Afghanistan 94/10 (14.1)
IND won by 127 runs
Afghanistan 159/8 (20.0) · India 163/3 (14.5)
IND won by 7 wickets
Afghanistan 156/8 (20.0) · India 157/3 (13.4)
IND won by 7 wickets
Central Delhi Kings 182/8 (20.0) · South Delhi Superstarz 186/3 (18.2)
SDS won by 7 wickets
Central Delhi Kings 218/5 (20.0) · Purani Delhi-6 146/10 (17.4)
CDK won by 72 runs
South Delhi Superstarz 193/7 (20.0) · Central Delhi Kings 178/10 (19.4)
SDS won by 15 runs
Outer Delhi Warriors 179/10 (19.4) · Purani Delhi-6 183/3 (14.5)
PD won by 7 wickets
Purani Delhi-6 118/6 (10.0) · East Delhi Riders 108/6 (10.0)
EDR won by 10 runs
New Delhi Tigers 168/9 (20.0) · South Delhi Superstarz 171/5 (18.3)
SDS won by 5 wickets
North Delhi Strikers 166/7 (20.0) · Outer Delhi Warriors 127/7 (19.5)
NDS won by 39 runs
The average first-innings score at Arun Jaitley Stadium in T20Is is 174, across 13 matches in our records. The par score (middle of the last 10 first innings) is 159.
In T20Is at Arun Jaitley Stadium, sides batting first have won 33% of decided matches (3) and chasing sides 67% (6). Chasing has the edge.
The highest T20I total at Arun Jaitley Stadium is 221, and the lowest is 94.
The highest successful T20I chase at Arun Jaitley Stadium is 212. The lowest total defended is 202.
Pace bowlers have taken 60% of the wickets (with a known bowling type) in T20Is at Arun Jaitley Stadium, and spinners 40%.
Captains winning the toss in T20Is at Arun Jaitley Stadium chose to field 78% of the time, and the toss winner went on to win 44% of matches.
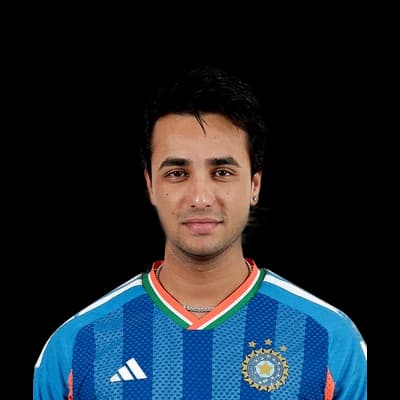
Abhishek Sharma has scored the most T20I runs at Arun Jaitley Stadium: 244 in 4 innings, averaging 61.
Axar Patel has taken the most T20I wickets at Arun Jaitley Stadium: 9 in 6 innings at an economy of 6.55.
Counted from UC Cricket's own ball-by-ball records; rebuilt nightly. Weather refreshes every few minutes.