Tarouba, West Indies · 133 matches on record
T20I Chasing has the edge at Brian Lara Stadium, based on 13 decided matches.
| Format | M | Avg 1st | Avg 2nd | Bat 1st won | Chased | Highest | Lowest | Top chase | Low defended | RR | Bdry % |
|---|---|---|---|---|---|---|---|---|---|---|---|
| T20I | 13 | 143 | 129 | 5 | 8 | 267 | 40 | 176 | 149 | 7.63 | 61 |
| ODI | 4 | 274 | 178 | 2 | 2 | 351 | 92 | 284 | 294 | 5.43 | 54 |
| Test | 1 | 311 | 282 | 1 | 0 | 311 | 120 | — | 311 | 3.26 | 50.4 |
| T20 | 73 | 145 | 135 | 32 | 39 | 218 | 46 | 197 | 101 | 7.55 | 57.4 |
| List A | 5 | 235 | 203 | 2 | 3 | 325 | 106 | 325 | 196 | 5.36 | — |
| First-class | 2 | 438 | 197 | 2 | 0 | 504 | 165 | — | 372 | 3.29 | — |
| T10 | 32 | 105 | 98 | 10 | 19 | 174 | 5 | 142 | 45 | 12.43 | — |
Last first innings: 108/4, 179/6, 174/7, 78/10, 40/10
| Phase | Run rate | Wkts |
|---|---|---|
| powerplay | 7.11 | 44 |
| middle | 7.46 | 60 |
| death | 8.86 | 54 |
Based on 13 matches.
Last first innings: 294/6, 171/7, 280/10, 351/5
| Phase | Run rate | Wkts |
|---|---|---|
| powerplay | 4.31 | 14 |
| middle | 5.02 | 35 |
| death | 10.10 | 9 |
Based on 4 matches.
Last first innings: 109/10, 179/6, 163/9, 178/6, 146/7
| Phase | Run rate | Wkts |
|---|---|---|
| powerplay | 7.00 | 186 |
| middle | 7.01 | 277 |
| death | 9.13 | 230 |
Based on 73 matches.
Last first innings: 168/10, 231/10, 0/0, 196/10, 256/8
Based on 6 matches.
Last first innings: 57/3, 107/5, 93/4, 122/4, 0/0
Based on 33 matches.
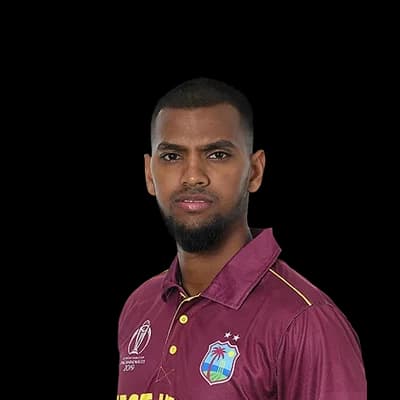 Nicholas Pooran244
 Shai Hope193
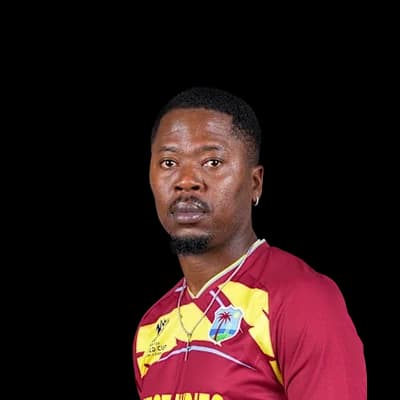 Sherfane Rutherford163
 Phil Salt157
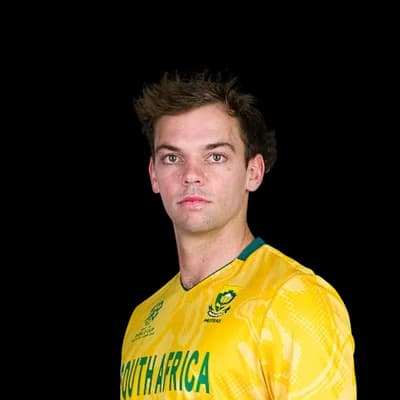 Tristan Stubbs144
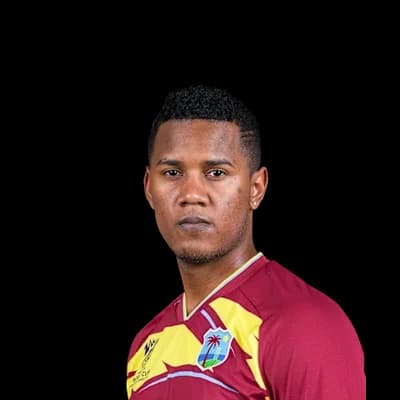 Akeal Hosein10
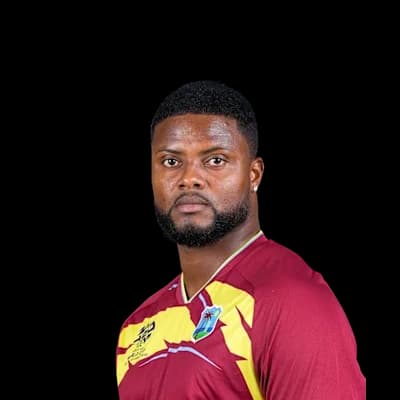 Romario Shepherd8
 Tim Southee7
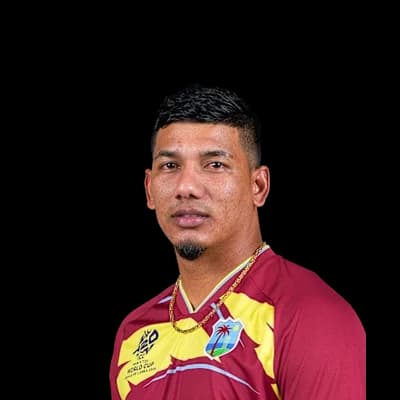 Gudakesh Motie7
 Trent Boult7Shai Hope212
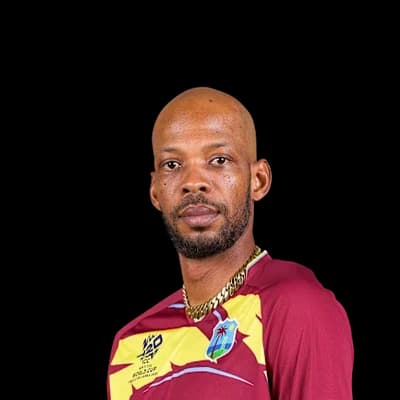 Roston Chase138
 Hasan Nawaz112
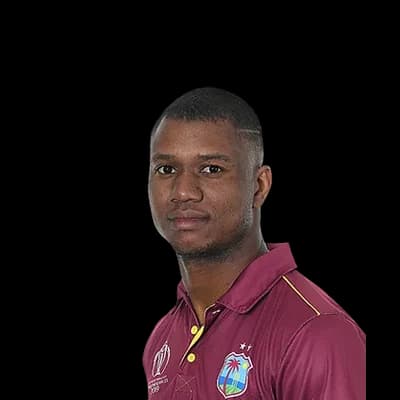 Evin Lewis104
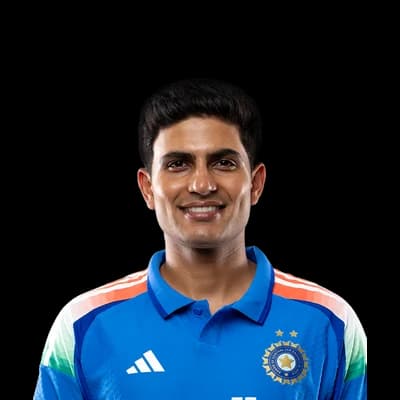 Shubman Gill85
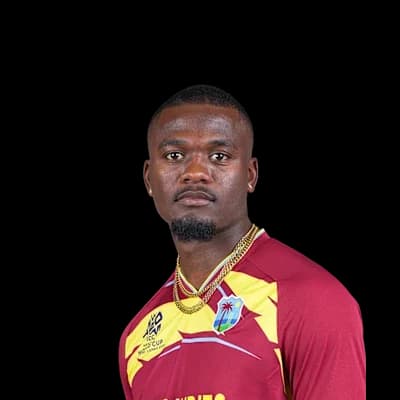 Jayden Seales10Gudakesh Motie5
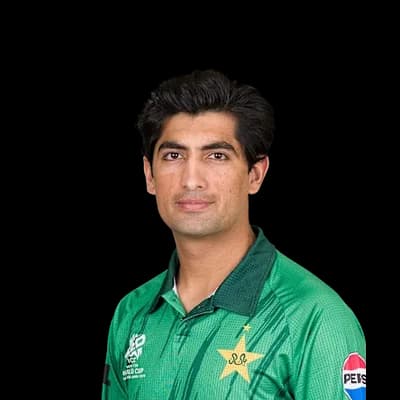 Naseem Shah5
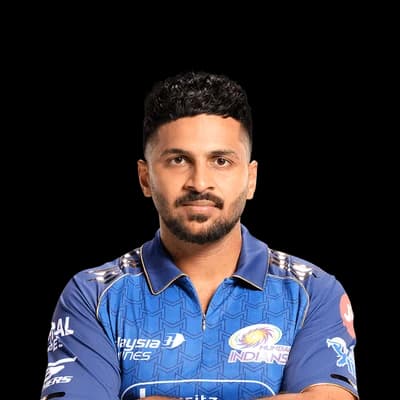 Shardul Thakur4
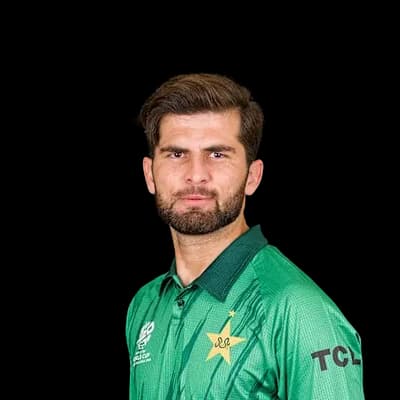 Shaheen Afridi4
 Shan Masood112Shai Hope102
 Kavem Hodge84
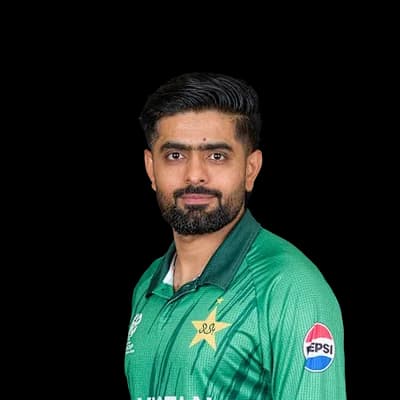 Babar Azam81
 Imam ul Haq66
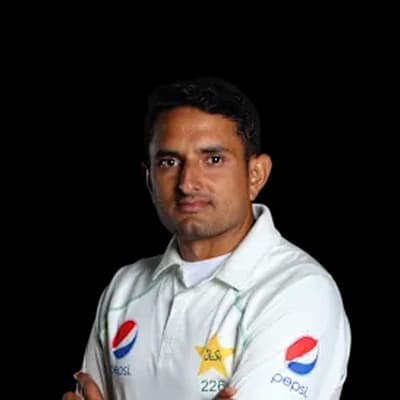 Mohammad Abbas8
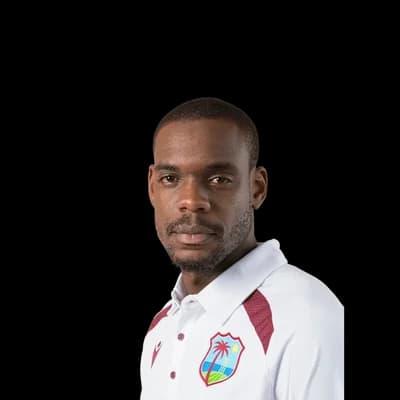 Justin Greaves7Mohammad Ali6Jayden Seales6
 Khurram Shahzad4
 Colin Munro662Nicholas Pooran522
 Andre Fletcher441
 Johnson Charles435
 Darren Bravo392
 Sunil Narine21Akeal Hosein19
 Imran Tahir18Roston Chase17
 Scott Kuggeleijn16
Photos: ICC, IPL, BCCI, Joeyjackets, CC BY-SA 4.0, via Wikimedia Commons, Harrias, CC BY-SA 3.0, via Wikimedia Commons
27°C
clear
Feels 32°C · Humidity 85% · Wind 11.5 km/h · Cloud 15%
Rain outlook: no rain expected
Dew: likely – Heavy dew is likely from about 21:00; the side bowling second may find the ball wet.
| Month | High | Low | Rain mm | Rain days |
|---|---|---|---|---|
| January | 30° | 23° | 46.5 | 12.5 |
| February | 30° | 23° | 30.2 | 8.4 |
| March | 31° | 23° | 38.6 | 10.3 |
| April | 32° | 24° | 47.2 | 9.4 |
| May | 32° | 25° | 68.8 | 13.6 |
| June | 30° | 24° | 161.7 | 21.9 |
| July | 30° | 24° | 156.3 | 25.1 |
| August | 31° | 24° | 168.9 | 26.5 |
| September | 31° | 25° | 128.4 | 21.9 |
| October | 31° | 25° | 146.8 | 22.1 |
| November | 30° | 24° | 126.9 | 23.3 |
| December | 29° | 24° | 97.2 | 17.1 |
| Team | Format | P | W | L | Win % | Avg | Highest |
|---|---|---|---|---|---|---|---|
| Trinbago Knight Riders | T20 | 27 | 22 | 5 | 81% | 152 | 197 |
| Guyana Amazon Warriors | T20 | 15 | 7 | 8 | 47% | 128 | 181 |
| SAMP Army Cocrico Cavaliers | T10 | 13 | 7 | 4 | 54% | 104 | 152 |
| St Kitts and Nevis Patriots | T20 | 13 | 2 | 10 | 15% | 135 | 193 |
| Bess Motors Blue Devils | T10 | 12 | 8 | 4 | 67% | 106 | 174 |
| Soca Kings | T10 | 12 | 5 | 4 | 42% | 96 | 148 |
| Chicago Steelpan Players | T10 | 11 | 4 | 5 | 36% | 113 | 161 |
| Jamaica Tallawahs | T20 | 11 | 1 | 9 | 9% | 140 | 168 |
West Indies 311/10 (98.5) · Pakistan 282/10 (80.1) · West Indies 181/10 (54.5) · Pakistan 120/10 (40.2)
WI won by 90 runs
Trinidad & Tobago Red Force 168/10 (42.3) · Barbados Pride 169/1 (29.3)
BP won by 9 wickets
Jamaica Scorpions 231/10 (44.4) · Windward Volcanoes 233/9 (49.1)
WIS won by 1 wicket
Jamaica Scorpions 0/0 ()
no result
Guyana Harpy Eagles 196/10 (40.3) · Trinidad & Tobago Red Force 106/4 (21.2)
TRF won by 6 runs (DLS Method)
The average first-innings score at Brian Lara Stadium in T20Is is 143, across 13 matches in our records. The par score (middle of the last 10 first innings) is 149.
In T20Is at Brian Lara Stadium, sides batting first have won 38% of decided matches (5) and chasing sides 62% (8). Chasing has the edge.
The highest T20I total at Brian Lara Stadium is 267, and the lowest is 40.
The highest successful T20I chase at Brian Lara Stadium is 176. The lowest total defended is 149.
Pace bowlers have taken 66% of the wickets (with a known bowling type) in T20Is at Brian Lara Stadium, and spinners 34%.
Captains winning the toss in T20Is at Brian Lara Stadium chose to field 92% of the time, and the toss winner went on to win 69% of matches.
Nicholas Pooran has scored the most T20I runs at Brian Lara Stadium: 244 in 8 innings, averaging 34.9.
Akeal Hosein has taken the most T20I wickets at Brian Lara Stadium: 10 in 8 innings at an economy of 5.35.
Counted from UC Cricket's own ball-by-ball records; rebuilt nightly. Weather refreshes every few minutes.
