Grenada, West Indies · Capacity 20,000 · 49 matches on record
ODI Evenly balanced between batting first and chasing at National Cricket Stadium, based on 21 decided matches.
| Format | M | Avg 1st | Avg 2nd | Bat 1st won | Chased | Highest | Lowest | Top chase | Low defended | RR | Bdry % |
|---|---|---|---|---|---|---|---|---|---|---|---|
| T20I | 15 | 136 | 127 | 6 | 7 | 226 | 7 | 226 | 166 | 7.37 | 59.1 |
| ODI | 21 | 235 | 200 | 10 | 11 | 418 | 70 | 232 | 208 | 4.93 | 45.8 |
| Test | 4 | 257 | 312 | 1 | 3 | 464 | 28 | 464 | 286 | 3.06 | 51.2 |
| T20 | 2 | 130 | 133 | 0 | 2 | 140 | 124 | 140 | — | 6.82 | 53.6 |
| List A | 7 | 234 | 199 | 3 | 4 | 280 | 119 | 277 | 213 | 5.01 | — |
Last first innings: 119/5, 119/5, 101/10, 101/9, 49/10
| Phase | Run rate | Wkts |
|---|---|---|
| powerplay | 8.27 | 30 |
| middle | 6.58 | 61 |
| death | 9.58 | 56 |
Based on 15 matches.
Last first innings: 217/7, 217/7, 208/10, 208/10, 240/6
| Phase | Run rate | Wkts |
|---|---|---|
| powerplay | 4.50 | 51 |
| middle | 4.78 | 137 |
| death | 6.77 | 63 |
Based on 21 matches.
Last first innings: 286/10, 204/10, 299/10, 237/10
| Phase | Run rate | Wkts |
|---|---|---|
| first | 3.08 | 48 |
| middle | 2.99 | 57 |
| late | 3.14 | 32 |
Based on 4 matches.
Last first innings: 213/10, 221/10, 276/9, 280/7, 249/9
Based on 7 matches.
 Quinton De Kock255
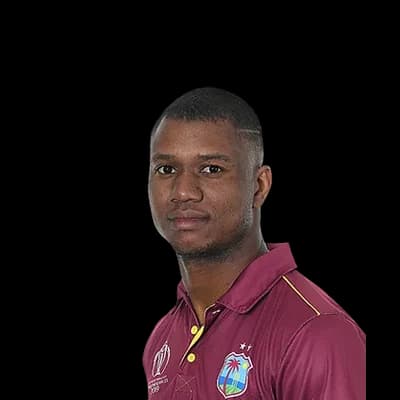 Evin Lewis231
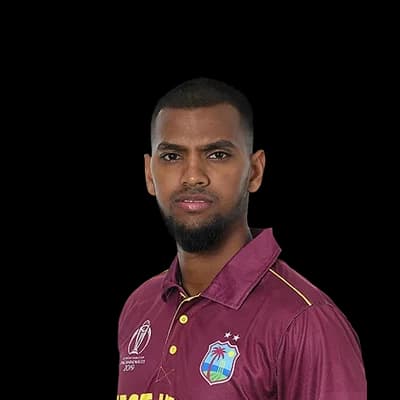 Nicholas Pooran184
 Phil Salt134
 Aiden Markram113
 Dwayne Bravo12
 Obed McCoy9
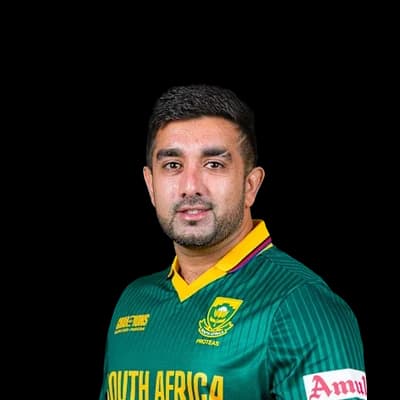 Tabraiz Shamsi7
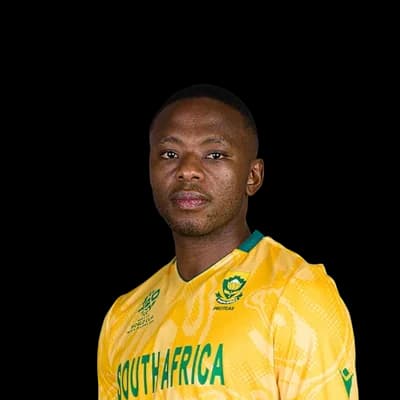 Kagiso Rabada7
 George Linde6
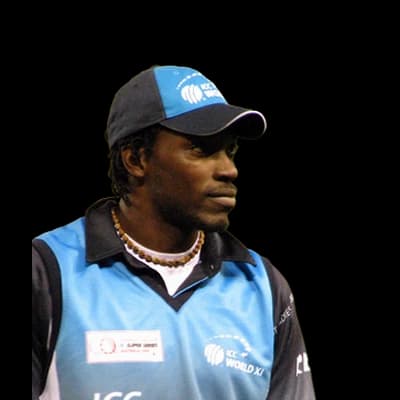 Chris Gayle318Darren Bravo293
 Ricky Ponting214
 Scott Styris194
 Shane Watson191
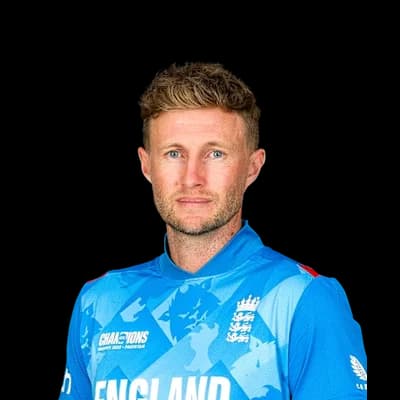 Joe Root187
 Kraigg Brathwaite161
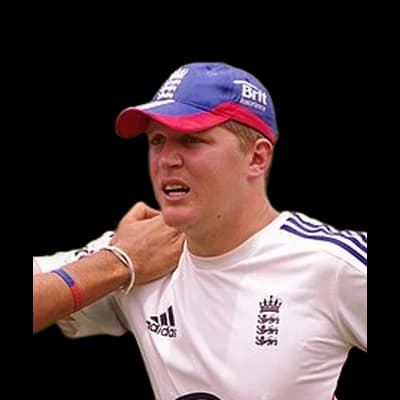 Gary Ballance158Travis Dowlin144
 Marlon Samuels140
 Kemar Roach11
 Alzarri Joseph9
 Shakib Al Hasan8
 Jayden Seales8
 Kyle Mayers7
 Ross Taylor62Darren Bravo54Denesh Ramdin51
 Ben Dunk38Shane Dowrich37
 Jimmy Neesham3Sheldon Cottrell3
 Kevin O'Brien2Dwayne Bravo2Ben Laughlin2
Photos: ICC, Helenabella, CC BY-SA 3.0, via Wikimedia Commons, Dannow at English Wikipedia, Public domain, via Wikimedia Commons, YellowMonkey/Blnguyen, CC BY-SA 4.0, via Wikimedia Commons, Avenue, GFDL 1.2, via Wikimedia Commons, paddynapper, CC BY-SA 2.0, via Wikimedia Commons, CC BY 3.0, via Wikimedia Commons, NAPARAZZI, CC BY-SA 2.0, via Wikimedia Commons, Evadb, Public domain, via Wikimedia Commons, Nurunnaby Chowdhury (Hasive), CC BY-SA 4.0, via Wikimedia Commons, Calistemon, CC BY-SA 4.0, via Wikimedia Commons, New Zealand Government, Office of the Governor-General, CC BY 4.0, via Wikimedia Commons, Harrias, CC BY-SA 3.0, via Wikimedia Commons
28°C
clear
Feels 32°C · Humidity 79% · Wind 18.8 km/h · Cloud 12%
Rain outlook: small chance of a shower
Dew: likely – Heavy dew is likely from about 03:00; the side bowling second may find the ball wet.
| Month | High | Low | Rain mm | Rain days |
|---|---|---|---|---|
| January | 28° | 25° | 54 | 15.6 |
| February | 28° | 24° | 45.7 | 14 |
| March | 28° | 25° | 48.4 | 15.9 |
| April | 29° | 25° | 43.8 | 14.5 |
| May | 29° | 26° | 58.2 | 17.2 |
| June | 29° | 26° | 114.2 | 21.8 |
| July | 29° | 26° | 133.5 | 25.5 |
| August | 29° | 26° | 108.9 | 23.6 |
| September | 30° | 26° | 89.2 | 19.2 |
| October | 29° | 26° | 120.6 | 21.8 |
| November | 29° | 26° | 130.9 | 22.6 |
| December | 28° | 25° | 81.8 | 19.8 |
| Team | Format | P | W | L | Win % | Avg | Highest |
|---|---|---|---|---|---|---|---|
| West Indies | ODI | 10 | 6 | 4 | 60% | 238 | 389 |
| West Indies | T20I | 8 | 3 | 5 | 38% | 174 | 222 |
| England Under-19s | List A | 7 | 2 | 5 | 29% | 212 | 277 |
| West Indies Under-19s | List A | 7 | 5 | 2 | 71% | 221 | 280 |
| South Africa | T20I | 5 | 3 | 2 | 60% | 161 | 168 |
| Australia | ODI | 4 | 4 | 0 | 100% | 255 | 348 |
| West Indies | T20I | 4 | 1 | 2 | 25% | 87 | 119 |
| West Indies | Test | 4 | 1 | 3 | 25% | 222 | 307 |
West Indies 119/5 (20.0) · Sri Lanka 121/1 (17.4)
West Indies Women 119/5 (20.0) · Sri Lanka Women 121/1 (17.4)
SL-W won by 9 wickets
West Indies 101/10 (20.0) · Sri Lanka 102/6 (18.1)
West Indies Women 101/9 (20.0) · Sri Lanka Women 102/6 (18.1)
SL-W won by 4 wickets
West Indies 49/10 (13.3) · Sri Lanka 7/0 (2.5)
no result
The average first-innings score at National Cricket Stadium in ODIs is 235, across 21 matches in our records. The par score (middle of the last 10 first innings) is 217.
In ODIs at National Cricket Stadium, sides batting first have won 48% of decided matches (10) and chasing sides 52% (11). Evenly balanced between batting first and chasing.
The highest ODI total at National Cricket Stadium is 418, and the lowest is 70.
The highest successful ODI chase at National Cricket Stadium is 232. The lowest total defended is 208.
Pace bowlers have taken 59% of the wickets (with a known bowling type) in ODIs at National Cricket Stadium, and spinners 41%.
Captains winning the toss in ODIs at National Cricket Stadium chose to field 62% of the time, and the toss winner went on to win 33% of matches.
Chris Gayle has scored the most ODI runs at National Cricket Stadium: 318 in 6 innings, averaging 53.
Dwayne Bravo has taken the most ODI wickets at National Cricket Stadium: 11 in 7 innings at an economy of 5.22.
Counted from UC Cricket's own ball-by-ball records; rebuilt nightly. Weather refreshes every few minutes.