Jamaica, West Indies · Capacity 20,000 · 120 matches on record
ODI Evenly balanced between batting first and chasing at Sabina Park, based on 23 decided matches.
| Format | M | Avg 1st | Avg 2nd | Bat 1st won | Chased | Highest | Lowest | Top chase | Low defended | RR | Bdry % |
|---|---|---|---|---|---|---|---|---|---|---|---|
| T20I | 14 | 169 | 156 | 6 | 8 | 215 | 85 | 194 | 96 | 8.40 | 62.8 |
| ODI | 24 | 239 | 202 | 10 | 13 | 349 | 99 | 255 | 198 | 4.90 | 48.4 |
| Test | 15 | 301 | 236 | 11 | 3 | 508 | 27 | 407 | 164 | 3.02 | 54.2 |
| T20 | 30 | 163 | 142 | 16 | 14 | 267 | 75 | 183 | 139 | 8.04 | 62.4 |
| First-class | 3 | 412 | 271 | 2 | 0 | 626 | 44 | — | 339 | 3.52 | — |
| T10 | 32 | 102 | 91 | 17 | 15 | 141 | 6 | 123 | 88 | 10.08 | — |
Last first innings: 169/10, 194/6, 147/9, 172/8, 189/8
| Phase | Run rate | Wkts |
|---|---|---|
| powerplay | 8.39 | 44 |
| middle | 7.85 | 71 |
| death | 9.53 | 65 |
Based on 14 matches.
Last first innings: 303/7, 212/10, 229/10, 269/10, 205/9
| Phase | Run rate | Wkts |
|---|---|---|
| powerplay | 4.30 | 64 |
| middle | 4.69 | 187 |
| death | 6.72 | 105 |
Based on 24 matches.
Last first innings: 225/10, 164/10, 302/9, 217/10, 416/10
| Phase | Run rate | Wkts |
|---|---|---|
| first | 2.82 | 215 |
| middle | 3.20 | 219 |
| late | 3.06 | 105 |
Based on 15 matches.
Last first innings: 181/6, 182/6, 117/10, 206/3, 176/6
| Phase | Run rate | Wkts |
|---|---|---|
| powerplay | 7.76 | 95 |
| middle | 7.46 | 165 |
| death | 9.72 | 125 |
Based on 30 matches.
Last first innings: 439/10, 457/10, 339/10
Based on 3 matches.
Last first innings: 105/3, 86/8, 114/6, 126/6, 96/6
Based on 32 matches.
 Brandon King336
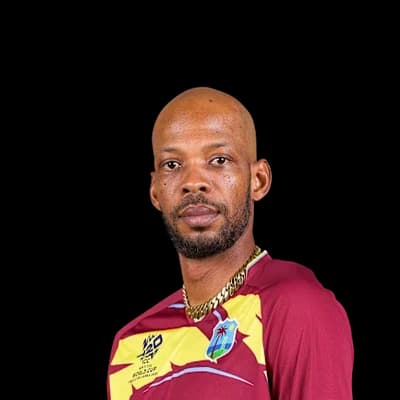 Roston Chase208
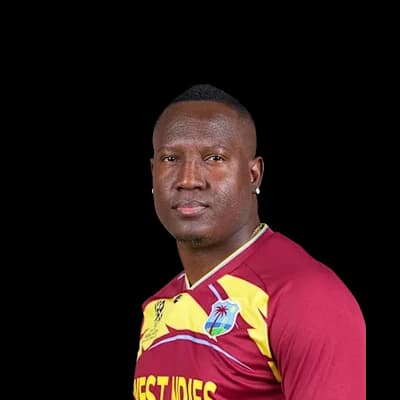 Rovman Powell165
 Shimron Hetmyer153
 Shai Hope135
 Shamar Joseph14
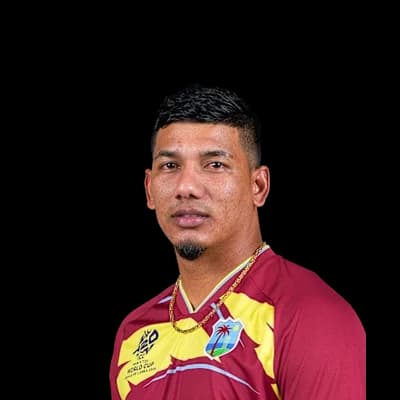 Gudakesh Motie10
 Obed McCoy9
 Jason Holder8Odean Smith7
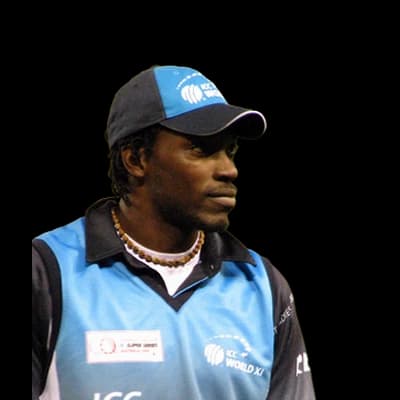 Chris Gayle517
 Ramnaresh Sarwan396
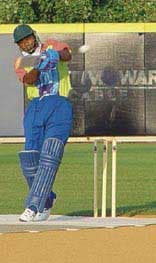 Marlon Samuels310
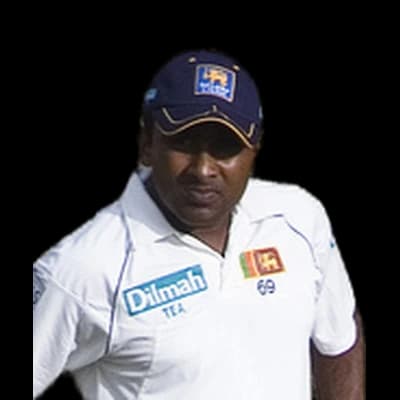 Mahela Jayawardene274
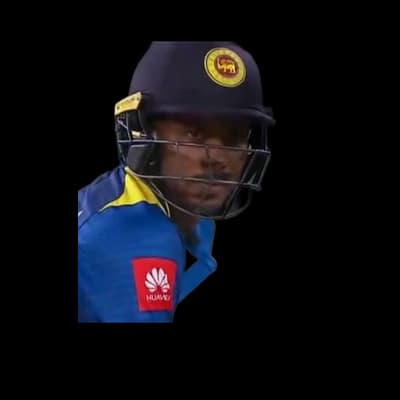 Upul Tharanga272
 Dwayne Bravo16
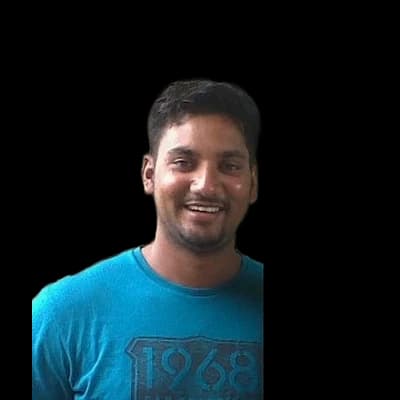 Ravi Rampaul12
 Jerome Taylor10
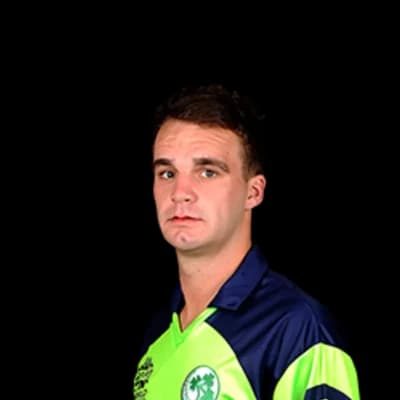 Andy McBrine10
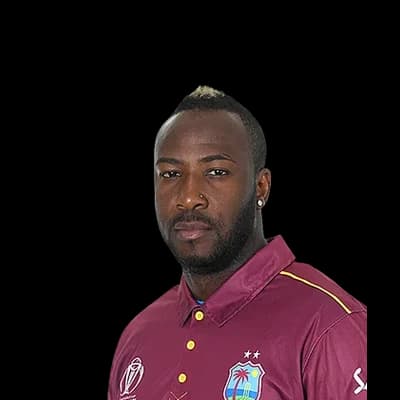 Andre Russell9Jason Holder469
 Kraigg Brathwaite397
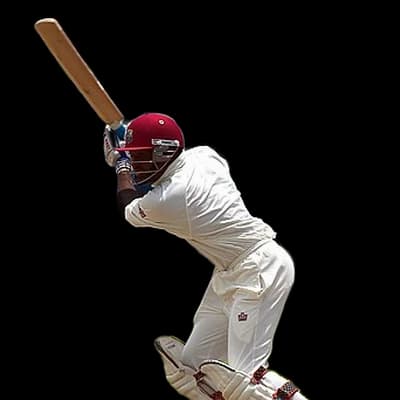 Shivnarine Chanderpaul385Roston Chase361
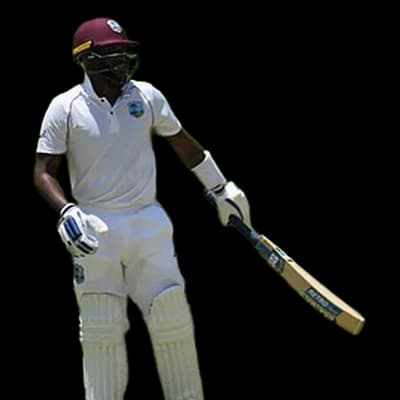 Jermaine Blackwood349Jason Holder29Jerome Taylor27
 Kemar Roach26
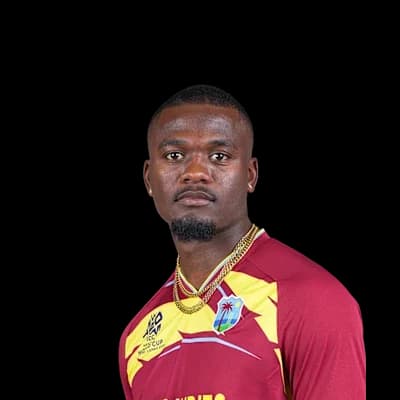 Jayden Seales19
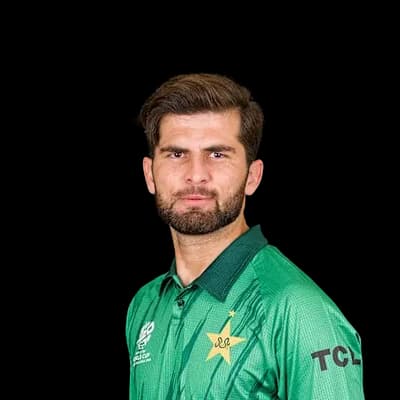 Shaheen Afridi18Chris Gayle560Chadwick Walton546
 Glenn Phillips464Rovman Powell462Andre Russell400Andre Russell28Krishmar Santokie22Jerome Taylor15Oshane Thomas11
 Dale Steyn10
Photos: ICC, Dannow at English Wikipedia, Public domain, via Wikimedia Commons, BIFF Cricket TV, CC BY 3.0, via Wikimedia Commons, Evadb, Public domain, via Wikimedia Commons, Hashir Milhan from Colombo, Sri Lanka, CC BY 2.0, via Wikimedia Commons, Pakistan Cricket Board, CC BY 3.0, via Wikimedia Commons, Helenabella, CC BY-SA 3.0, via Wikimedia Commons, The Madras, CC BY-SA 3.0, via Wikimedia Commons, Ukexpat, CC BY-SA 3.0, via Wikimedia Commons, Calistemon, CC BY-SA 4.0, via Wikimedia Commons, YellowMonkey/Blnguyen, CC BY-SA 4.0, via Wikimedia Commons
27°C
clear
Feels 32°C · Humidity 75% · Wind 1.1 km/h · Cloud 11%
Rain outlook: no rain expected
Dew: likely – Heavy dew is likely from about 00:00; the side bowling second may find the ball wet.
| Month | High | Low | Rain mm | Rain days |
|---|---|---|---|---|
| January | 29° | 21° | 21.8 | 6.4 |
| February | 29° | 21° | 23.9 | 7.4 |
| March | 29° | 21° | 31.6 | 7.6 |
| April | 30° | 22° | 44 | 9.3 |
| May | 30° | 24° | 59.9 | 10.5 |
| June | 31° | 24° | 41 | 7.5 |
| July | 32° | 24° | 43.2 | 6.2 |
| August | 32° | 25° | 52.8 | 8.6 |
| September | 31° | 25° | 65.4 | 11.5 |
| October | 30° | 24° | 125.8 | 16.9 |
| November | 29° | 23° | 92.5 | 11.4 |
| December | 29° | 22° | 29.8 | 6.9 |
| Team | Format | P | W | L | Win % | Avg | Highest |
|---|---|---|---|---|---|---|---|
| Jamaica Tallawahs | T20 | 25 | 16 | 9 | 64% | 153 | 226 |
| West Indies | ODI | 21 | 12 | 7 | 57% | 223 | 319 |
| West Indies | Test | 15 | 4 | 10 | 27% | 207 | 392 |
| West Indies | T20I | 14 | 8 | 6 | 57% | 160 | 207 |
| Middlesex Titans | T10 | 11 | 4 | 7 | 36% | 84 | 106 |
| Surrey Kings | T10 | 11 | 7 | 4 | 64% | 111 | 141 |
| Surrey Risers | T10 | 11 | 8 | 3 | 73% | 97 | 139 |
| Surrey Royals | T10 | 11 | 9 | 2 | 82% | 99 | 141 |
Jamaica Kingsmen 181/6 (20.0) · St Kitts and Nevis Patriots 130/10 (18.0)
Trinbago Knight Riders 182/6 (20.0) · Jamaica Kingsmen 183/5 (18.4)
Jamaica Kingsmen 117/10 (19.4) · Guyana Amazon Warriors 118/4 (14.1)
Barbados Tridents 206/3 (20.0) · Jamaica Kingsmen 201/9 (20.0)
The average first-innings score at Sabina Park in ODIs is 239, across 24 matches in our records. The par score (middle of the last 10 first innings) is 229.
In ODIs at Sabina Park, sides batting first have won 43% of decided matches (10) and chasing sides 57% (13). Evenly balanced between batting first and chasing.
The highest ODI total at Sabina Park is 349, and the lowest is 99.
The highest successful ODI chase at Sabina Park is 255. The lowest total defended is 198.
Pace bowlers have taken 66% of the wickets (with a known bowling type) in ODIs at Sabina Park, and spinners 34%.
Captains winning the toss in ODIs at Sabina Park chose to field 75% of the time, and the toss winner went on to win 48% of matches.
Chris Gayle has scored the most ODI runs at Sabina Park: 517 in 12 innings, averaging 47.
Dwayne Bravo has taken the most ODI wickets at Sabina Park: 16 in 10 innings at an economy of 5.02.
Counted from UC Cricket's own ball-by-ball records; rebuilt nightly. Weather refreshes every few minutes.
