Chennai, India · Capacity 38,200 · 169 matches on record
T20I Batting first has the edge at MA Chidambaram Stadium, based on 18 decided matches.
| Format | M | Avg 1st | Avg 2nd | Bat 1st won | Chased | Highest | Lowest | Top chase | Low defended | RR | Bdry % |
|---|---|---|---|---|---|---|---|---|---|---|---|
| T20I | 21 | 169 | 140 | 11 | 7 | 256 | 80 | 182 | 103 | 8.12 | 57.3 |
| ODI | 20 | 234 | 220 | 9 | 9 | 337 | 69 | 291 | 171 | 5.28 | 49 |
| Test | 9 | 426 | 385 | 4 | 3 | 759 | 19 | 572 | 329 | 3.32 | 51.2 |
| T20 | 113 | 163 | 150 | 53 | 46 | 246 | 15 | 213 | 126 | 8.13 | 57.7 |
| List A | 3 | 199 | 200 | 0 | 3 | 240 | 147 | 240 | — | 4.52 | — |
| First-class | 1 | 708 | 336 | 0 | 0 | 708 | 336 | — | — | 3.86 | 53.4 |
Last first innings: 256/4, 200/4, 173/4, 199/4, 196/6
| Phase | Run rate | Wkts |
|---|---|---|
| powerplay | 8.03 | 43 |
| middle | 7.77 | 77 |
| death | 9.38 | 65 |
Based on 21 matches.
Last first innings: 218/10, 270/10, 245/9, 199/10, 269/10
| Phase | Run rate | Wkts |
|---|---|---|
| powerplay | 5.10 | 66 |
| middle | 5.12 | 140 |
| death | 6.22 | 87 |
Based on 20 matches.
Last first innings: 376/10, 603/6, 329/10, 578/10, 477/10
| Phase | Run rate | Wkts |
|---|---|---|
| first | 3.33 | 73 |
| middle | 3.42 | 96 |
| late | 3.21 | 118 |
Based on 9 matches.
Last first innings: 182/7, 183/5, 15/0, 50/1, 169/8
| Phase | Run rate | Wkts |
|---|---|---|
| powerplay | 8.24 | 304 |
| middle | 7.52 | 525 |
| death | 9.45 | 496 |
Based on 113 matches.
Last first innings: 239/10, 211/9, 147/10
Based on 3 matches.
 Tim Seifert160
 Tazmin Brits153
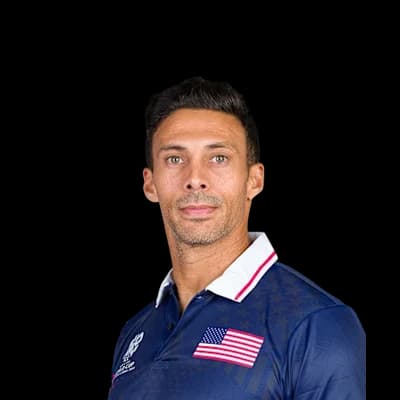
 Yuvraj Samra127
 Glenn Phillips118
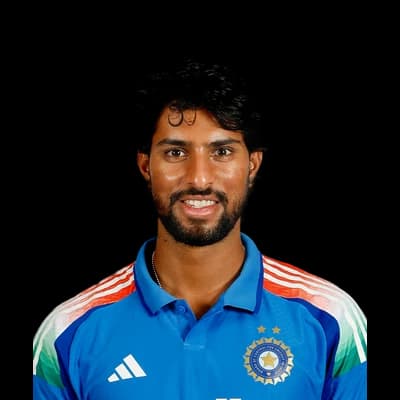 N. Tilak Varma116
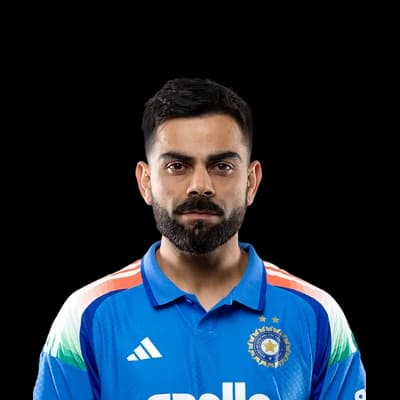 Virat Kohli422
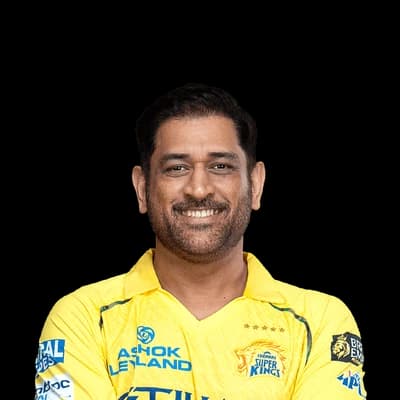 MS Dhoni401
 Yuvraj Singh257
 AB de Villiers220
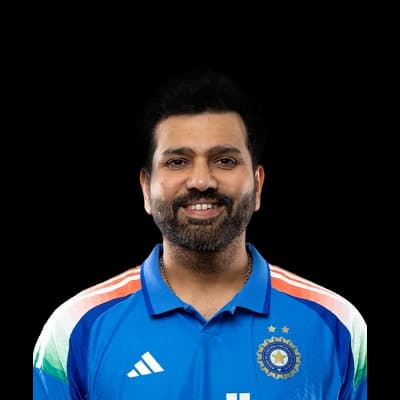 Rohit Sharma219
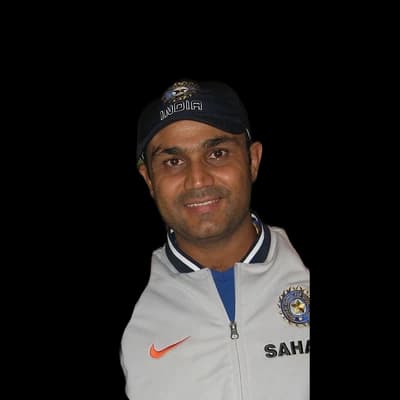 Virender Sehwag599
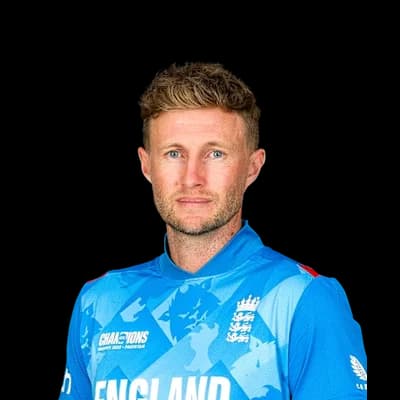 Joe Root391
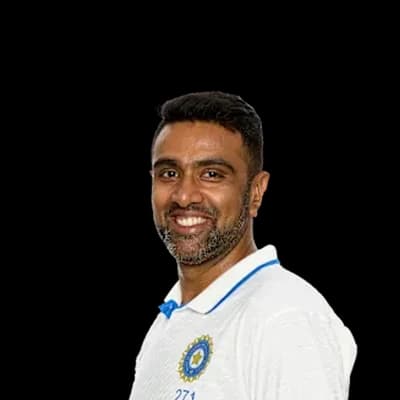 Ravichandran Ashwin342
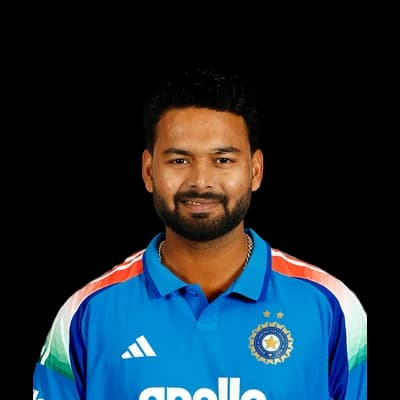 Rishabh Pant316
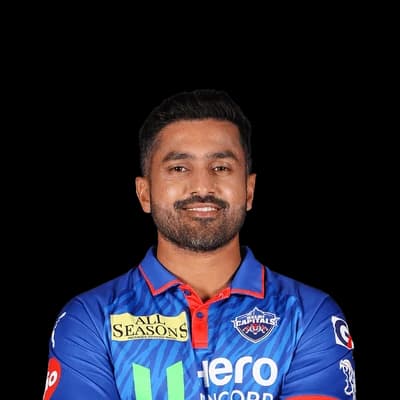 Karun Nair303Ravichandran Ashwin36
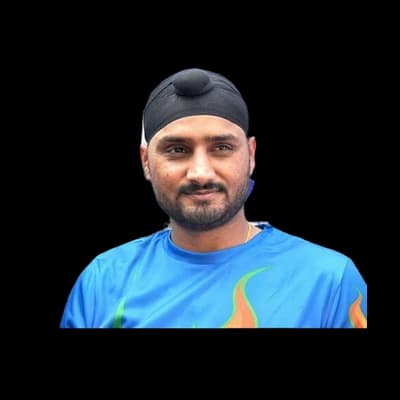 Harbhajan Singh20
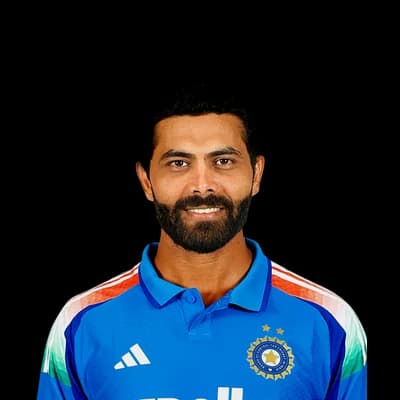 Ravindra Jadeja20
 Anil Kumble16
 Jack Leach12MS Dhoni1547
 Suresh Raina1498
 Ruturaj Gaikwad1012
 Murali Vijay928
 Michael Hussey848Ravichandran Ashwin52
 Dwayne Bravo44Ravindra Jadeja37
 Albie Morkel36
 Deepak Chahar24
Photos: ICC, BCCI, Prime Minister's Office, GODL-India, via Wikimedia Commons, IPL, YellowMonkey/Blnguyen, CC BY-SA 4.0, via Wikimedia Commons, Press Information Department, Public domain, via Wikimedia Commons, Flying Cloud, CC BY 2.0, via Wikimedia Commons, Bollywood Hungama, CC BY 3.0, via Wikimedia Commons, shrivsa from Bangalore, India, CC BY-SA 2.0, via Wikimedia Commons, Harrias, CC BY-SA 3.0, via Wikimedia Commons, Dee03, CC BY-SA 3.0, via Wikimedia Commons, Helenabella, CC BY-SA 3.0, via Wikimedia Commons
25°C
overcast
Feels 26°C · Humidity 61% · Wind 12.5 km/h · Cloud 100%
Rain outlook: no rain expected
Dew: unlikely – No dew expected this evening.
| Month | High | Low | Rain mm | Rain days |
|---|---|---|---|---|
| January | 28° | 22° | 36.2 | 6.3 |
| February | 29° | 23° | 5 | 1.2 |
| March | 31° | 24° | 12.3 | 2.5 |
| April | 33° | 27° | 9.9 | 2.9 |
| May | 35° | 28° | 79.8 | 6.9 |
| June | 35° | 28° | 69.8 | 12.2 |
| July | 34° | 27° | 108.6 | 16.7 |
| August | 33° | 26° | 145.7 | 18.8 |
| September | 32° | 26° | 145.1 | 19.8 |
| October | 30° | 25° | 225.9 | 20.7 |
| November | 29° | 24° | 340.2 | 19.2 |
| December | 28° | 23° | 190.6 | 12.3 |
| Team | Format | P | W | L | Win % | Avg | Highest |
|---|---|---|---|---|---|---|---|
| Chennai Super Kings | T20 | 84 | 55 | 28 | 65% | 165 | 246 |
| Kolkata Knight Riders | T20 | 17 | 6 | 11 | 35% | 150 | 202 |
| Mumbai Indians | T20 | 17 | 8 | 9 | 47% | 151 | 202 |
| Sunrisers Hyderabad | T20 | 14 | 4 | 9 | 29% | 152 | 181 |
| India | ODI | 12 | 6 | 4 | 50% | 234 | 299 |
| Royal Challengers Bangalore | T20 | 12 | 5 | 7 | 42% | 155 | 205 |
| Rajasthan Royals | T20 | 10 | 2 | 8 | 20% | 168 | 223 |
| India | Test | 9 | 5 | 1 | 56% | 346 | 759 |
East Zone 708/10 (163.0) · South Zone 336/10 (107.3) · East Zone 383/7 (99.2)
Match Drawn (East Zone won on 1st innings)
VIDA Kovai Kings 182/7 (20.0) · Siechem Madurai Panthers 98/10 (14.2)
VKK won by 84 runs
VIDA Kovai Kings 183/5 (20.0) · Trichy Grand Cholas 99/10 (15.4)
VKK won by 84 runs
IDream Tiruppur Tamizhans 15/0 (3.0)
No Result
Trichy Grand Cholas 50/1 (4.5)
No result
Salem Spartans 169/8 (20.0) · IDream Tiruppur Tamizhans 124/9 (20.0)
SS won by 45 runs
Siechem Madurai Panthers 198/5 (20.0) · Nellai Royal Kings 126/10 (19.1)
MP won by 72 runs
VIDA Kovai Kings 171/3 (16.0) · Dindigul Dragons 93/9 (13.2)
VKK won by 85 runs (DLS Method)
Trichy Grand Cholas 191/7 (20.0) · Chepauk Super Gillies 177/6 (20.0)
TGC won by 14 runs
Siechem Madurai Panthers 157/9 (20.0) · IDream Tiruppur Tamizhans 160/6 (17.4)
TT won by 4 wickets
The average first-innings score at MA Chidambaram Stadium in T20Is is 169, across 21 matches in our records. The par score (middle of the last 10 first innings) is 193.
In T20Is at MA Chidambaram Stadium, sides batting first have won 61% of decided matches (11) and chasing sides 39% (7). Batting first has the edge.
The highest T20I total at MA Chidambaram Stadium is 256, and the lowest is 80.
The highest successful T20I chase at MA Chidambaram Stadium is 182. The lowest total defended is 103.
Pace bowlers have taken 51% of the wickets (with a known bowling type) in T20Is at MA Chidambaram Stadium, and spinners 49%.
Captains winning the toss in T20Is at MA Chidambaram Stadium chose to field 58% of the time, and the toss winner went on to win 39% of matches.
Tim Seifert has scored the most T20I runs at MA Chidambaram Stadium: 160 in 3 innings, averaging 80.
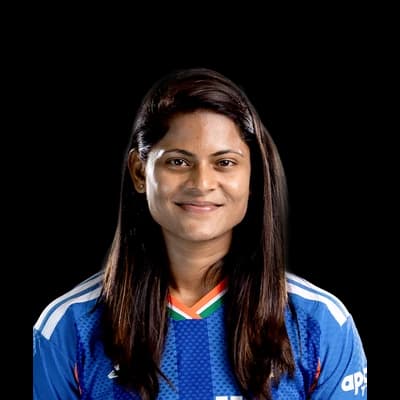
Pooja Vastrakar has taken the most T20I wickets at MA Chidambaram Stadium: 8 in 3 innings at an economy of 6.54.
Counted from UC Cricket's own ball-by-ball records; rebuilt nightly. Weather refreshes every few minutes.