Nagpur, India · 98 matches on record
T20I Batting first has the edge at Vidarbha Cricket Association Stadium, based on 12 decided matches.
| Format | M | Avg 1st | Avg 2nd | Bat 1st won | Chased | Highest | Lowest | Top chase | Low defended | RR | Bdry % |
|---|---|---|---|---|---|---|---|---|---|---|---|
| T20I | 12 | 146 | 127 | 7 | 5 | 238 | 78 | 123 | 126 | 7.51 | 54.2 |
| ODI | 12 | 263 | 241 | 3 | 9 | 354 | 113 | 351 | 250 | 5.47 | 47 |
| Test | 7 | 303 | 367 | 6 | 0 | 610 | 79 | — | 177 | 2.95 | 47.3 |
| T20 | 59 | 165 | 156 | 21 | 36 | 261 | 43 | 237 | 105 | 8.63 | 46.1 |
Last first innings: 238/7, 90/5, 174/5, 144/8, 122/8
| Phase | Run rate | Wkts |
|---|---|---|
| powerplay | 6.90 | 49 |
| middle | 7.53 | 52 |
| death | 8.36 | 59 |
Based on 12 matches.
Last first innings: 248/10, 250/10, 201/9, 113/10, 242/9
| Phase | Run rate | Wkts |
|---|---|---|
| powerplay | 5.23 | 28 |
| middle | 5.13 | 83 |
| death | 7.25 | 61 |
Based on 12 matches.
Last first innings: 177/10, 205/10, 215/10, 330/10, 193/10
| Phase | Run rate | Wkts |
|---|---|---|
| first | 3.09 | 73 |
| middle | 2.81 | 74 |
| late | 2.96 | 66 |
Based on 7 matches.
Last first innings: 249/3, 150/10, 107/4, 230/9, 147/10
| Phase | Run rate | Wkts |
|---|---|---|
| powerplay | 6.99 | 38 |
| middle | 6.88 | 59 |
| death | 7.80 | 67 |
Based on 59 matches.
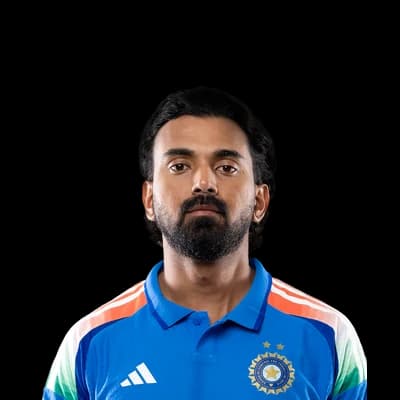 KL Rahul133
 Mark Chapman98
 Abhishek Sharma84
 Mohammad Naim Sheikh81
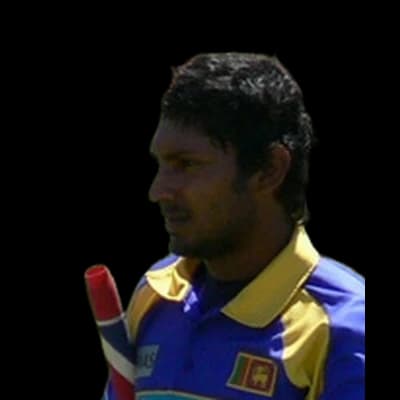 Kumar Sangakkara78
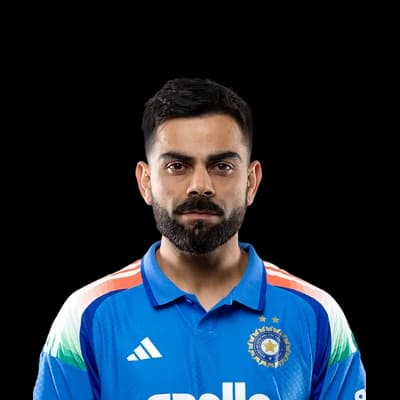 Virat Kohli325
 MS Dhoni268
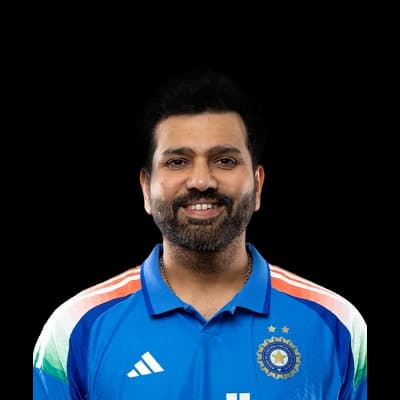 Rohit Sharma206
 Shane Watson183
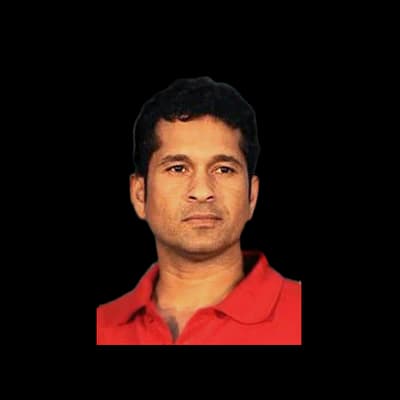 Sachin Tendulkar158
 Mitchell Johnson9
 Ravindra Jadeja9
 Harbhajan Singh5
 Dale Steyn5
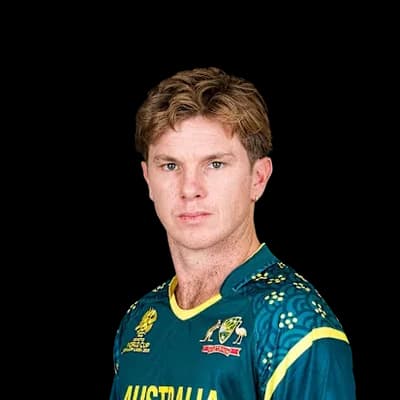 Adam Zampa4Virat Kohli366
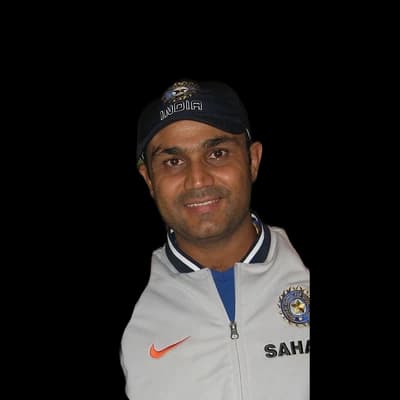 Virender Sehwag357MS Dhoni339
 Hashim Amla293Sachin Tendulkar291
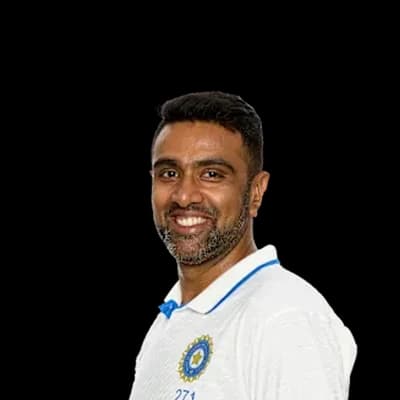 Ravichandran Ashwin31
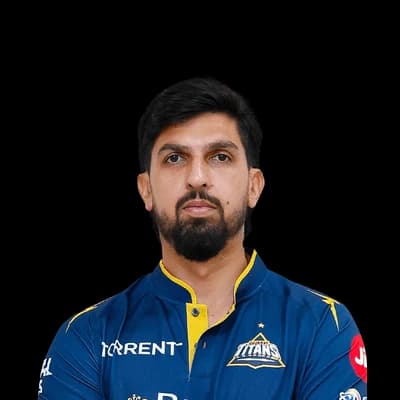 Ishant Sharma19Ravindra Jadeja19Harbhajan Singh13
 Jason Krejza12
 Faiz Fazal153
 Parthiv Patel146Rohit Sharma132Mohit Hooda103
 Apoorv Wankhade99RP Singh11
 Ryan Harris7Ravikumar Thakur7
 Jasprit Bumrah7Chama Milind6
Photos: BCCI, ICC, Sangakkara.jpg: TonyPatterson derivative work: Chamal N (talk), CC BY 2.0, via Wikimedia Commons, IPL, Chubby Chandru, CC BY 2.0, via Wikimedia Commons, paddynapper, CC BY-SA 2.0, via Wikimedia Commons, Bollywood Hungama, CC BY 3.0, via Wikimedia Commons, YellowMonkey/Blnguyen, CC BY-SA 4.0, via Wikimedia Commons, Flying Cloud, CC BY 2.0, via Wikimedia Commons, NAPARAZZI, CC BY-SA 2.0, via Wikimedia Commons
26°C
overcast
Feels 25°C · Humidity 42% · Wind 15.1 km/h · Cloud 100%
Rain outlook: no rain expected
Dew: unlikely – No dew expected this evening.
| Month | High | Low | Rain mm | Rain days |
|---|---|---|---|---|
| January | 28° | 15° | 10.6 | 1.5 |
| February | 31° | 18° | 4.9 | 1.1 |
| March | 36° | 22° | 8.2 | 2 |
| April | 40° | 26° | 11.4 | 1.6 |
| May | 41° | 29° | 16.4 | 3.3 |
| June | 36° | 27° | 155.9 | 16.6 |
| July | 30° | 25° | 497.5 | 26.2 |
| August | 30° | 24° | 327.4 | 23.4 |
| September | 30° | 24° | 239.9 | 22.2 |
| October | 31° | 22° | 66.7 | 8.4 |
| November | 30° | 18° | 4.6 | 0.7 |
| December | 28° | 16° | 7.1 | 1.7 |
| Team | Format | P | W | L | Win % | Avg | Highest |
|---|---|---|---|---|---|---|---|
| Pagariya Strikers | T20 | 17 | 13 | 4 | 76% | 175 | 249 |
| Bharat Rangers | T20 | 15 | 10 | 5 | 67% | 189 | 241 |
| NECO Master Blaster | T20 | 15 | 5 | 9 | 33% | 166 | 219 |
| Orange Tigers | T20 | 15 | 6 | 8 | 40% | 157 | 235 |
| Nagpur Heroz | T20 | 13 | 5 | 6 | 38% | 157 | 228 |
| India | Test | 8 | 5 | 1 | 62% | 358 | 610 |
| India | ODI | 7 | 5 | 2 | 71% | 292 | 354 |
| India Warriors | T20 | 7 | 2 | 5 | 29% | 185 | 261 |
Pagariya Strikers 249/3 (20.0) · Bharat Rangers 241/8 (20.0)
PAS won by 8 runs
Orange Tigers 150/10 (19.4) · Pagariya Strikers 152/5 (19.0)
PAS won by 5 wickets
Orange Tigers 107/4 (7.5)
no result
Pagariya Strikers 230/9 (20.0) · Bharat Rangers 233/5 (19.3)
BHR won by 5 wickets
India Warriors 147/10 (18.4) · Pagariya Strikers 150/3 (14.5)
PAS won by 7 wickets
The average first-innings score at Vidarbha Cricket Association Stadium in T20Is is 146, across 12 matches in our records. The par score (middle of the last 10 first innings) is 127.
In T20Is at Vidarbha Cricket Association Stadium, sides batting first have won 58% of decided matches (7) and chasing sides 42% (5). Batting first has the edge.
The highest T20I total at Vidarbha Cricket Association Stadium is 238, and the lowest is 78.
The highest successful T20I chase at Vidarbha Cricket Association Stadium is 123. The lowest total defended is 126.
Pace bowlers have taken 56% of the wickets (with a known bowling type) in T20Is at Vidarbha Cricket Association Stadium, and spinners 44%.
Captains winning the toss in T20Is at Vidarbha Cricket Association Stadium chose to field 58% of the time, and the toss winner went on to win 33% of matches.
KL Rahul has scored the most T20I runs at Vidarbha Cricket Association Stadium: 133 in 3 innings, averaging 44.3.
Deepak Chahar has taken the most T20I wickets at Vidarbha Cricket Association Stadium: 6 in 1 innings at an economy of 2.1.
Counted from UC Cricket's own ball-by-ball records; rebuilt nightly. Weather refreshes every few minutes.