Indore, India · 86 matches on record
ODI Evenly balanced between batting first and chasing at Holkar Cricket Stadium, based on 16 decided matches.
| Format | M | Avg 1st | Avg 2nd | Bat 1st won | Chased | Highest | Lowest | Top chase | Low defended | RR | Bdry % |
|---|---|---|---|---|---|---|---|---|---|---|---|
| T20I | 4 | 213 | 176 | 2 | 1 | 260 | 142 | 144 | 227 | 10.14 | 69 |
| ODI | 16 | 278 | 237 | 9 | 7 | 418 | 97 | 294 | 247 | 5.97 | 57.3 |
| Test | 3 | 272 | 330 | 2 | 1 | 557 | 78 | 197 | 150 | 3.35 | 54.3 |
| T20 | 57 | 171 | 168 | 15 | 40 | 258 | 41 | 258 | 157 | 9.27 | 61.6 |
| First-class | 1 | 194 | 152 | 1 | 0 | 248 | 152 | — | 194 | 3.19 | — |
Last first innings: 223/10, 227/3, 142/9, 260/5
| Phase | Run rate | Wkts |
|---|---|---|
| powerplay | 9.90 | 8 |
| middle | 9.86 | 25 |
| death | 11.10 | 23 |
Based on 4 matches.
Last first innings: 337/8, 97/10, 97/10, 244/9, 244/9
| Phase | Run rate | Wkts |
|---|---|---|
| powerplay | 5.65 | 28 |
| middle | 5.95 | 88 |
| death | 7.80 | 55 |
Based on 16 matches.
Last first innings: 109/10, 150/10, 557/5
| Phase | Run rate | Wkts |
|---|---|---|
| first | 3.25 | 33 |
| middle | 3.00 | 37 |
| late | 4.12 | 15 |
Based on 3 matches.
Last first innings: 224/5, 41/4, 213/8, 96/2, 221/3
| Phase | Run rate | Wkts |
|---|---|---|
| powerplay | 8.19 | 63 |
| middle | 7.71 | 102 |
| death | 10.03 | 73 |
Based on 57 matches.
 KL Rahul134
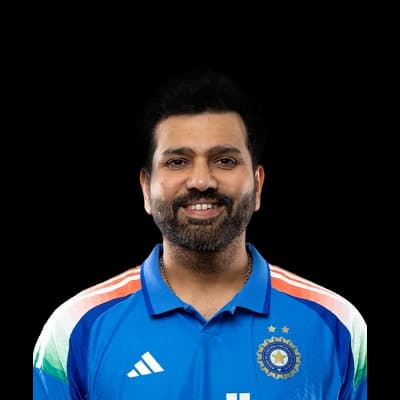 Rohit Sharma118
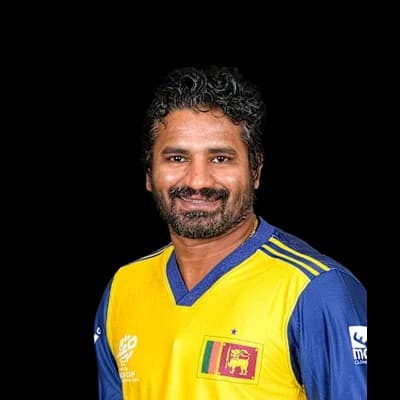 Kusal Perera111
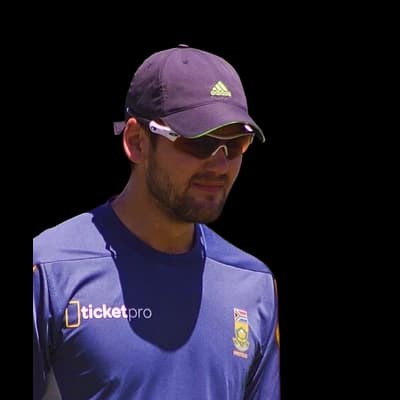 Rilee Rossouw100
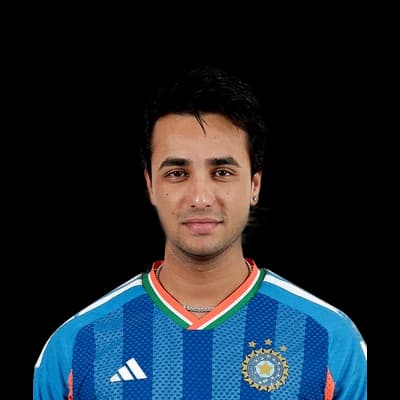 Abhishek Sharma69
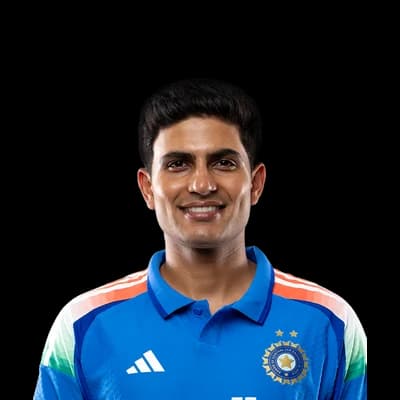 Shubman Gill239
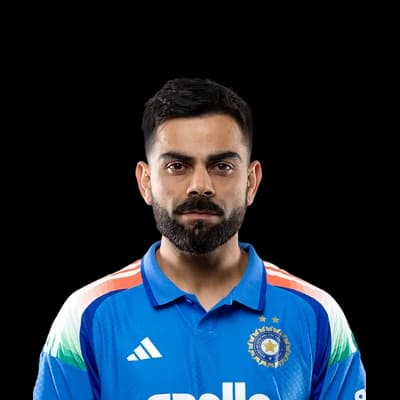 Virat Kohli223
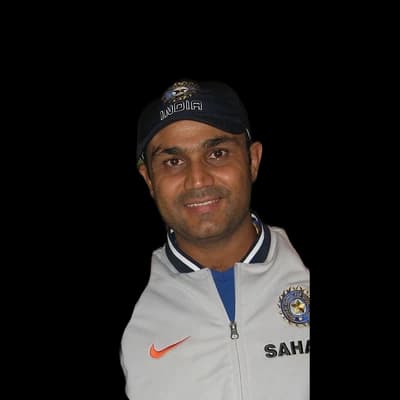 Virender Sehwag219
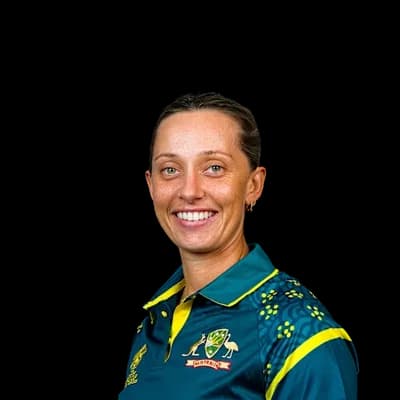 Ashleigh Gardner219Rohit Sharma213
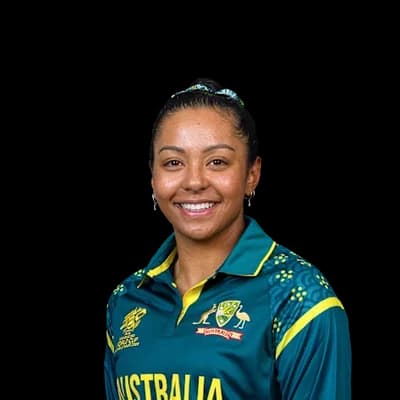 Alana King10
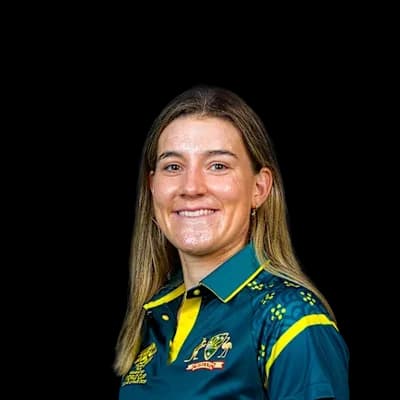 Annabel Sutherland6
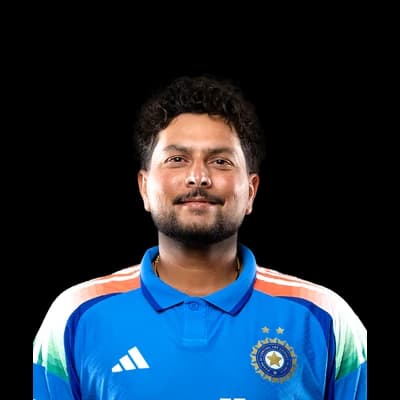 Kuldeep Yadav6
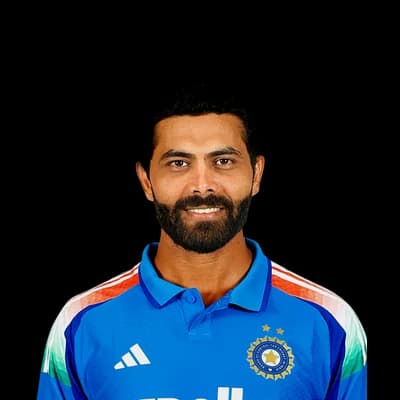 Ravindra Jadeja6
 Sophie Molineux5
 Ajinkya Rahane297Virat Kohli263
 Cheteshwar Pujara256
 Mayank Agarwal243
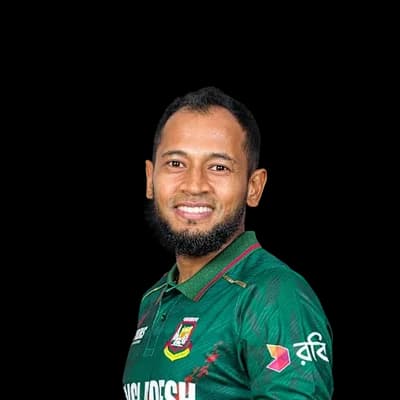 Mushfiqur Rahim107
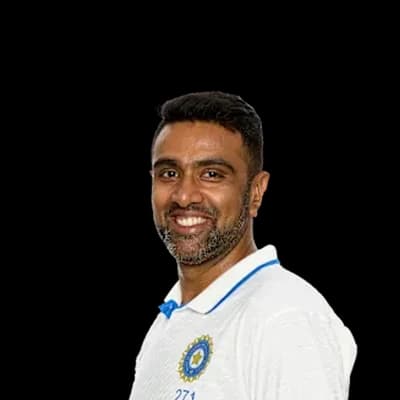 Ravichandran Ashwin22
 Nathan Lyon11
 Umesh Yadav8Ravindra Jadeja8
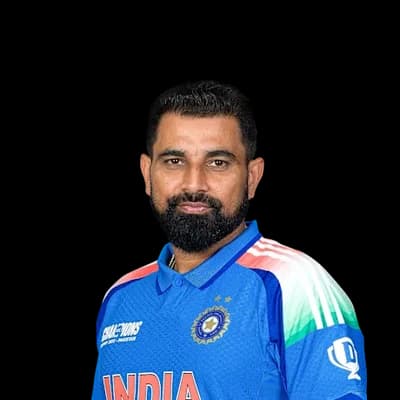 Mohammad Shami7KL Rahul195
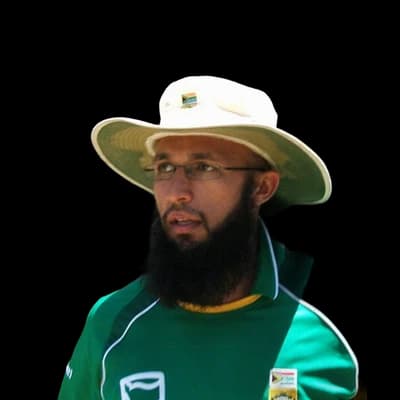 Hashim Amla190
 Urvil Patel150
 Priyank Panchal148
 Krunal Pandya144
 Chintan Gaja7
 Andrew Tye7
 Anuj Raj6
 Piyush Chawla6Mayank Dagar6
Photos: BCCI, ICC, NAPARAZZI, CC BY-SA 2.0, via Wikimedia Commons, IPL, Flying Cloud, CC BY 2.0, via Wikimedia Commons, Akshayparmar.gu, CC BY-SA 4.0, via Wikimedia Commons, Dee03, CC BY-SA 3.0, via Wikimedia Commons, YellowMonkey/Blnguyen, CC BY-SA 4.0, via Wikimedia Commons, Dee03, CC BY-SA 4.0, via Wikimedia Commons, www.davidmolloyphotography.com from Sydney, Australia, CC BY 2.0, via Wikimedia Commons, Blnguyen, CC BY-SA 3.0, via Wikimedia Commons
20°C
partly cloudy
Feels 18°C · Humidity 49% · Wind 10.5 km/h · Cloud 78%
Rain outlook: no rain expected
Dew: unlikely – No dew expected this evening.
| Month | High | Low | Rain mm | Rain days |
|---|---|---|---|---|
| January | 25° | 13° | 10 | 1.5 |
| February | 29° | 15° | 1.3 | 0.4 |
| March | 33° | 19° | 3 | 1 |
| April | 38° | 24° | 3.4 | 1.1 |
| May | 39° | 26° | 6.7 | 1.8 |
| June | 35° | 25° | 137.7 | 14.7 |
| July | 29° | 23° | 352.5 | 26 |
| August | 28° | 23° | 331.7 | 24.9 |
| September | 29° | 22° | 221.5 | 19.3 |
| October | 30° | 20° | 42.3 | 6.4 |
| November | 29° | 17° | 8.5 | 0.9 |
| December | 26° | 14° | 8.6 | 1.5 |
| Team | Format | P | W | L | Win % | Avg | Highest |
|---|---|---|---|---|---|---|---|
| Chamble Ghariyals | T20 | 9 | 8 | 0 | 89% | 204 | 258 |
| Royal Nimar Eagles | T20 | 9 | 5 | 2 | 56% | 155 | 193 |
| Jabalpur Lions | T20 | 8 | 3 | 4 | 38% | 182 | 224 |
| Kings XI Punjab | T20 | 8 | 4 | 4 | 50% | 166 | 214 |
| Rewa Jaguars | T20 | 8 | 4 | 2 | 50% | 168 | 238 |
| Bhopal Leopards | T20 | 7 | 3 | 4 | 43% | 185 | 223 |
| Bundelkhand Bulls | T20 | 7 | 1 | 5 | 14% | 158 | 219 |
| Gwalior Cheetahs | T20 | 7 | 1 | 5 | 14% | 194 | 257 |
India 223/10 (20.0) · West Indies 209/7 (20.0)
IND won by 14 runs
The average first-innings score at Holkar Cricket Stadium in ODIs is 278, across 16 matches in our records. The par score (middle of the last 10 first innings) is 244.
In ODIs at Holkar Cricket Stadium, sides batting first have won 56% of decided matches (9) and chasing sides 44% (7). Evenly balanced between batting first and chasing.
The highest ODI total at Holkar Cricket Stadium is 418, and the lowest is 97.
The highest successful ODI chase at Holkar Cricket Stadium is 294. The lowest total defended is 247.
Pace bowlers have taken 56% of the wickets (with a known bowling type) in ODIs at Holkar Cricket Stadium, and spinners 44%.
Captains winning the toss in ODIs at Holkar Cricket Stadium chose to field 44% of the time, and the toss winner went on to win 62% of matches.
Shubman Gill has scored the most ODI runs at Holkar Cricket Stadium: 239 in 3 innings, averaging 79.7.
Alana King has taken the most ODI wickets at Holkar Cricket Stadium: 10 in 3 innings at an economy of 3.28.
Counted from UC Cricket's own ball-by-ball records; rebuilt nightly. Weather refreshes every few minutes.