
Niranjan Shah Stadium – Pitch Report, Records & Stats
Rajkot, India · Capacity 28,000 · 187 matches on record
ODI Batting first has the edge at Niranjan Shah Stadium, based on 11 decided matches.
Niranjan Shah Stadium pitch report
T20I · 6 matches
- In 6 T20Is here, the side batting first has averaged 186; the highest total is 228.
- Chasing sides have won 33% of decided matches, so batting first is the better bet.
- The highest successful chase is 202.
- Captains winning the toss chose to field 67% of the time.
- Pace bowlers have taken 61% of the wickets here.
- Scoring is quickest in the death overs at 9.9 an over.
ODI · 11 matches
- In 11 ODIs here, the side batting first has averaged 332; the highest total is 435.
- Chasing sides have won 27% of decided matches, so batting first is the better bet.
- The highest successful chase is 286.
- Captains winning the toss chose to field 18% of the time.
- Spinners have taken 42% of the wickets here.
- Scoring is quickest in the death overs at 7.5 an over.
T20 · 70 matches
- In 70 T20s here, the side batting first has averaged 154; the highest total is 230.
- Chasing sides have won 57% of decided matches, so chasing is the better bet.
- The highest successful chase is 194.
- Captains winning the toss chose to field 52% of the time.
- Pace bowlers have taken 61% of the wickets here.
- Scoring is quickest in the death overs at 9.5 an over.
List A · 32 matches
- In 32 List A matches here, the side batting first has averaged 282; the highest total is 391.
- Chasing sides have won 49% of decided matches, so neither side has the edge.
- The highest successful chase is 330.
- Captains winning the toss chose to field 80% of the time.
- Scoring is quickest in the death overs at 7.8 an over.
First-class · 52 matches
- In 52 first-class matches here, the side batting first has averaged 360; the highest total is 659.
- Sides batting first have won 81% of the matches with a result.
- Spinners have taken 75% of the wickets here.
- Scoring is quickest in the late overs at 3.7 an over.
Records by format
| Format | M | Avg 1st | Avg 2nd | Bat 1st won | Chased | Highest | Lowest | Top chase | Low defended | RR | Bdry % |
|---|---|---|---|---|---|---|---|---|---|---|---|
| T20I | 6 | 186 | 147 | 4 | 2 | 228 | 87 | 202 | 169 | 8.74 | 63.3 |
| ODI | 11 | 332 | 245 | 8 | 3 | 435 | 131 | 286 | 270 | 6.18 | 51.8 |
| Test | 3 | 544 | 329 | 2 | 0 | 649 | 122 | — | 445 | 3.66 | 55.2 |
| T20 | 70 | 154 | 142 | 29 | 38 | 230 | 12 | 194 | 70 | 8.17 | 55.9 |
| List A | 32 | 282 | 247 | 18 | 17 | 391 | 132 | 330 | 182 | 5.88 | 57.3 |
| First-class | 52 | 360 | 326 | 25 | 6 | 659 | 15 | 439 | 102 | 3.13 | 52.5 |
Par score & toss impact
T20I
- Par score
- 196
- Toss winner won
- 67%
- Chose to field
- 67%
- Bat-first won
- 67%
Last first innings: 171/9, 228/5, 169/6, 153/6, 196/2
| Phase | Run rate | Wkts |
|---|---|---|
| powerplay | 8.53 | 18 |
| middle | 8.32 | 37 |
| death | 9.95 | 22 |
Based on 6 matches.
ODI
- Par score
- 352
- Toss winner won
- 73%
- Chose to field
- 18%
- Bat-first won
- 73%
Last first innings: 284/7, 435/5, 435/5, 370/5, 370/5
| Phase | Run rate | Wkts |
|---|---|---|
| powerplay | 6.00 | 9 |
| middle | 5.79 | 56 |
| death | 7.50 | 42 |
Based on 11 matches.
Test
- Par score
- 537
- Toss winner won
- 100%
- Chose to field
- 0%
- Bat-first won
- 100%
Last first innings: 445/10, 649/9, 537/10
| Phase | Run rate | Wkts |
|---|---|---|
| first | 3.78 | 32 |
| middle | 3.41 | 28 |
| late | 3.78 | 32 |
Based on 3 matches.
T20
- Par score
- 181
- Toss winner won
- 54%
- Chose to field
- 52%
- Bat-first won
- 43%
Last first innings: 142/10, 197/3, 114/10, 73/2, 181/5
| Phase | Run rate | Wkts |
|---|---|---|
| powerplay | 8.04 | 93 |
| middle | 7.56 | 152 |
| death | 9.52 | 136 |
Based on 71 matches.
List A
- Par score
- 341
- Toss winner won
- 0%
- Chose to field
- 80%
- Bat-first won
- 50%
Last first innings: 254/10, 341/7, 182/6, 391/10, 352/5
| Phase | Run rate | Wkts |
|---|---|---|
| powerplay | 6.57 | 8 |
| middle | 6.29 | 24 |
| death | 7.77 | 12 |
Based on 32 matches.
First-class
- Par score
- 260
- Toss winner won
- —
- Chose to field
- —
- Bat-first won
- 79%
Last first innings: 281/10, 217/10, 172/10, 585/7, 260/10
| Phase | Run rate | Wkts |
|---|---|---|
| first | 2.59 | 23 |
| middle | 3.29 | 16 |
| late | 3.69 | 21 |
Based on 52 matches.
Top players at Niranjan Shah Stadium
T20I
- Most runs
 Surya Kumar Yadav126
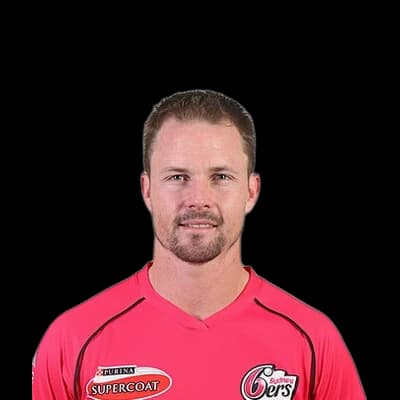 Colin Munro109
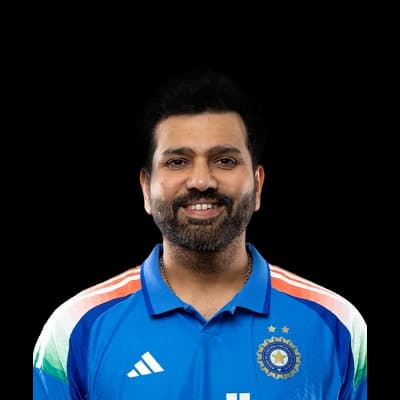 Rohit Sharma98
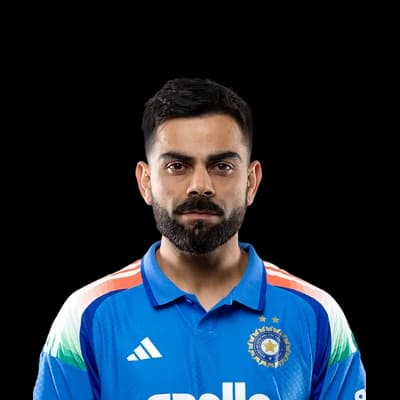 Virat Kohli94
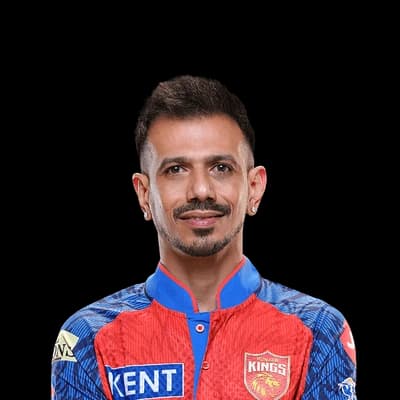
 Hardik Pandya91



ODI
- Most runs
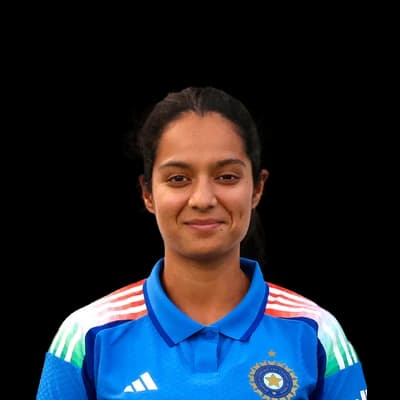 Pratika Rawal310
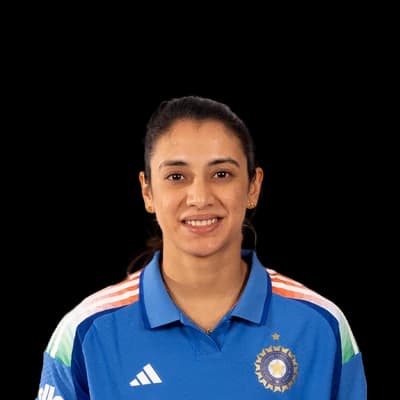 Smriti Mandhana249
- Virat Kohli249
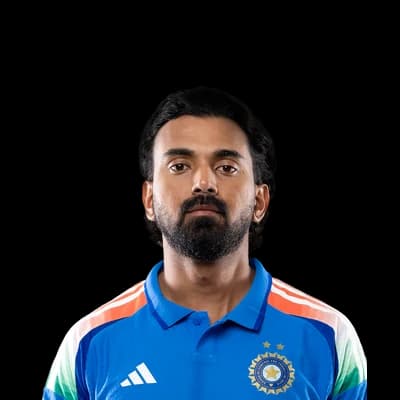 KL Rahul218
- Rohit Sharma212
- Most wickets
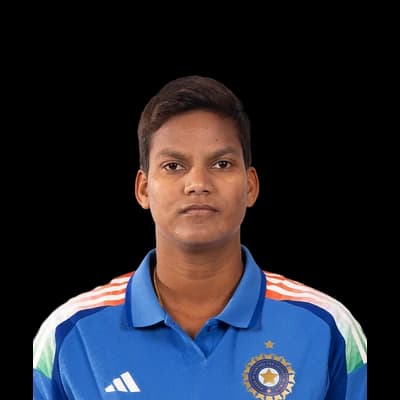 Deepti Sharma7
 Kuldeep Yadav5
 Jasprit Bumrah4
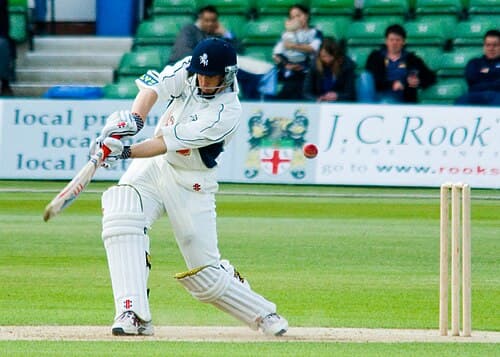 James Tredwell4
 Morne Morkel4
Test
- Most runs
 Ravindra Jadeja256
- Virat Kohli228
 Cheteshwar Pujara228
 Yashasvi Jaiswal224
 Ben Stokes213
- Most wickets
- Ravindra Jadeja14
 Ravichandran Ashwin11
- Kuldeep Yadav10
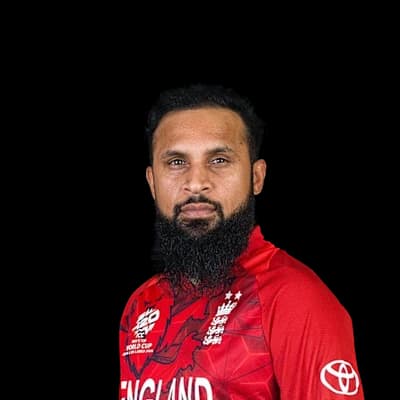 Adil Rashid7
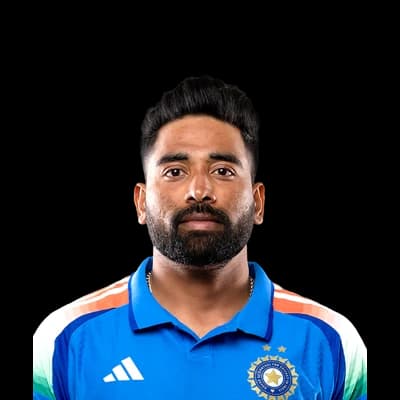 Mohammed Siraj4
T20
- Most runs
 Suresh Raina328
 Brendon McCullum279
 Pankaj Shaw228
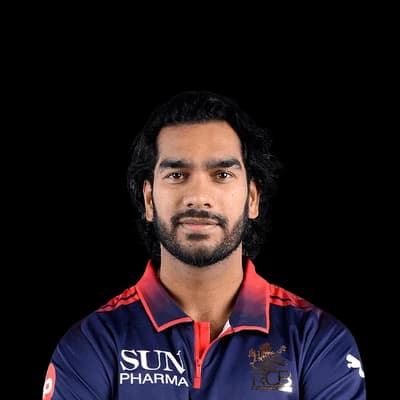 Venkatesh Iyer226
 Rajat Patidar225
- Most wickets
 Aniket Choudhary16
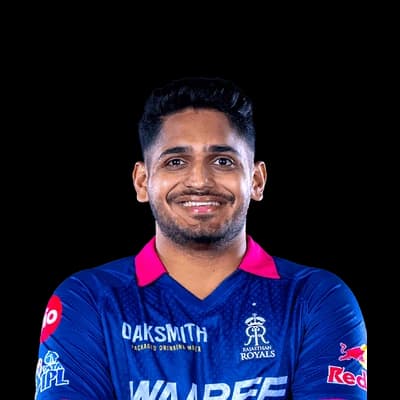 Tushar Deshpande12
- Kumar Kartikeya12
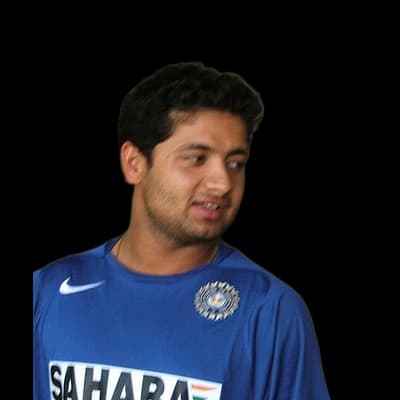 Piyush Chawla11
- Dhawal Kulkarni11
Photos: BCCI, Cricket Australia, IPL, Paul Burgess, CC BY-SA 3.0, via Wikimedia Commons, YellowMonkey/Blnguyen, CC BY-SA 4.0, via Wikimedia Commons, NAPARAZZI, CC BY-SA 2.0, via Wikimedia Commons, ICC, Bollywood Hungama, CC BY 3.0, via Wikimedia Commons, Ben Sutherland from Crystal Palace, London, UK, CC BY 2.0, via Wikimedia Commons, CRICKETNEXT, CC BY 3.0, via Wikimedia Commons, Blnguyen, CC BY-SA 3.0, via Wikimedia Commons
Weather at Niranjan Shah Stadium
23°C
clear
Feels 25°C · Humidity 63% · Wind 1.5 km/h · Cloud 0%
Rain outlook: no rain expected
Dew: likely – Heavy dew is likely from about 02:00; the side bowling second may find the ball wet.
| Month | High | Low | Rain mm | Rain days |
|---|---|---|---|---|
| January | 28° | 13° | 1.6 | 0.5 |
| February | 31° | 16° | 0 | 0 |
| March | 35° | 20° | 1 | 0.1 |
| April | 39° | 23° | 1.8 | 0.4 |
| May | 40° | 26° | 13.2 | 1.7 |
| June | 38° | 27° | 79.5 | 10.4 |
| July | 32° | 26° | 250.3 | 21.5 |
| August | 31° | 25° | 287 | 17.4 |
| September | 31° | 24° | 181.2 | 12.5 |
| October | 34° | 23° | 37.2 | 4.8 |
| November | 32° | 19° | 7.9 | 0.8 |
| December | 29° | 15° | 0.9 | 0.2 |
Team records at Niranjan Shah Stadium
| Team | Format | P | W | L | Win % | Avg | Highest |
|---|---|---|---|---|---|---|---|
| Saurashtra | First-class | 51 | 20 | 8 | 39% | 296 | 632 |
| Anmol Kings Halar | T20 | 10 | 4 | 5 | 40% | 155 | 202 |
| Gujarat Lions | T20 | 10 | 3 | 6 | 30% | 162 | 192 |
| JMD Kutch Riders | T20 | 10 | 5 | 4 | 50% | 121 | 168 |
| Aryan Sorath Lions | T20 | 9 | 4 | 4 | 44% | 124 | 214 |
| Bengal | List A | 9 | 2 | 6 | 22% | 256 | 320 |
| Dita Gohilwad Titans | T20 | 9 | 4 | 4 | 44% | 158 | 199 |
| Madhya Pradesh | T20 | 8 | 6 | 2 | 75% | 168 | 216 |
Recent matches at Niranjan Shah Stadium
- Ranji Trophy Elite 202626 Oct 2026 · First-class
Assam 281/10 (112.3) · Saurashtra 387/10 (131.4) · Assam 94/10 (44.0)
SAU won by an inning and 12 runs
- Australia U19 tour of India 202627 Sept 2026 · First-class
Australia Under-19s 217/10 (86.5) · India Under-19s 494/10 (102.3) · Australia Under-19s 229/10 (59.4)
IND-U19 won by an inning and 48 runs
- Australia U19 tour of India 202623 Sept 2026 · List A
Australia Under-19s 254/10 (49.3) · India Under-19s 255/4 (41.2)
- Australia U19 tour of India 202621 Sept 2026 · List A
India Under-19s 341/7 (50.0) · Australia Under-19s 238/10 (41.1)
IND-U19 won by 103 runs
- Australia U19 tour of India 202618 Sept 2026 · List A
India Under-19s 182/6 (20.0) · Australia Under-19s 175/7 (20.0)
IND-U19 won by 7 runs
Niranjan Shah Stadium: frequently asked questions
What is the average first-innings score at Niranjan Shah Stadium in ODIs?
The average first-innings score at Niranjan Shah Stadium in ODIs is 332, across 11 matches in our records. The par score (middle of the last 10 first innings) is 352.
Is it better to bat first or chase at Niranjan Shah Stadium?
In ODIs at Niranjan Shah Stadium, sides batting first have won 73% of decided matches (8) and chasing sides 27% (3). Batting first has the edge.
What is the highest ODI total at Niranjan Shah Stadium?
The highest ODI total at Niranjan Shah Stadium is 435, and the lowest is 131.
What is the highest successful chase at Niranjan Shah Stadium in ODIs?
The highest successful ODI chase at Niranjan Shah Stadium is 286. The lowest total defended is 270.
Does the pitch at Niranjan Shah Stadium help pace or spin?
Pace bowlers have taken 58% of the wickets (with a known bowling type) in ODIs at Niranjan Shah Stadium, and spinners 42%.
What do captains choose after winning the toss at Niranjan Shah Stadium?
Captains winning the toss in ODIs at Niranjan Shah Stadium chose to field 18% of the time, and the toss winner went on to win 73% of matches.
Who has scored the most ODI runs at Niranjan Shah Stadium?
Pratika Rawal has scored the most ODI runs at Niranjan Shah Stadium: 310 in 3 innings, averaging 103.3.
Who has taken the most ODI wickets at Niranjan Shah Stadium?
Deepti Sharma has taken the most ODI wickets at Niranjan Shah Stadium: 7 in 3 innings at an economy of 3.66.
More grounds in India
View all →Counted from UC Cricket's own ball-by-ball records; rebuilt nightly. Weather refreshes every few minutes.