
Daren Sammy National Cricket Stadium – Pitch Report, Records & Stats
Gros Islet, West Indies · Capacity 20,000 · Opened 2002 · 176 matches on record
T20I Evenly balanced between batting first and chasing at Daren Sammy National Cricket Stadium, based on 43 decided matches.
Daren Sammy National Cricket Stadium pitch report
T20I · 44 matches
- In 44 T20Is here, the side batting first has averaged 146; the highest total is 221.
- Chasing sides have won 56% of decided matches, so chasing is the better bet.
- The highest successful chase is 221.
- Captains winning the toss chose to field 55% of the time.
- Spinners have taken 45% of the wickets here.
- Scoring is quickest in the death overs at 8.4 an over.
ODI · 27 matches
- In 27 ODIs here, the side batting first has averaged 222; the highest total is 363.
- Chasing sides have won 57% of decided matches, so chasing is the better bet.
- The highest successful chase is 282.
- Captains winning the toss chose to field 75% of the time.
- Pace bowlers have taken 71% of the wickets here.
- Scoring is quickest in the death overs at 7.1 an over.
Test · 10 matches
- In 10 Tests here, the side batting first has averaged 325; the highest total is 588.
- Sides batting first have won 83% of the matches with a result.
- Captains winning the toss chose to field 62% of the time.
- Pace bowlers have taken 78% of the wickets here.
- Scoring is quickest in the late overs at 3.2 an over.
T20 · 54 matches
- In 54 T20s here, the side batting first has averaged 157; the highest total is 226.
- Chasing sides have won 61% of decided matches, so chasing is the better bet.
- The highest successful chase is 218.
- Captains winning the toss chose to field 77% of the time.
- Pace bowlers have taken 65% of the wickets here.
- Scoring is quickest in the death overs at 10.3 an over.
T10 · 30 matches
- In 30 T10 matches here, the side batting first has averaged 100; the highest total is 137.
- Chasing sides have won 57% of decided matches, so chasing is the better bet.
- The highest successful chase is 122.
- Captains winning the toss chose to field 73% of the time.
Records by format
| Format | M | Avg 1st | Avg 2nd | Bat 1st won | Chased | Highest | Lowest | Top chase | Low defended | RR | Bdry % |
|---|---|---|---|---|---|---|---|---|---|---|---|
| T20I | 44 | 146 | 134 | 19 | 24 | 221 | 44 | 221 | 97 | 7.41 | 54.6 |
| ODI | 27 | 222 | 204 | 10 | 13 | 363 | 27 | 282 | 172 | 5.06 | 46.5 |
| Test | 10 | 325 | 276 | 5 | 1 | 588 | 13 | 408 | 97 | 3.04 | 45.6 |
| T20 | 54 | 157 | 145 | 20 | 31 | 226 | 10 | 218 | 152 | 8.44 | 61.8 |
| List A | 3 | 300 | 195 | 1 | 1 | 365 | 87 | 258 | 283 | 6.30 | — |
| First-class | 4 | 282 | 331 | 1 | 2 | 600 | 100 | 332 | 480 | 3.87 | — |
| T10 | 30 | 100 | 98 | 12 | 16 | 137 | 1 | 122 | 102 | 11.14 | — |
Par score & toss impact
T20I
- Par score
- 180
- Toss winner won
- 44%
- Chose to field
- 55%
- Bat-first won
- 44%
Last first innings: 44/0, 218/5, 145/8, 205/5, 163/6
| Phase | Run rate | Wkts |
|---|---|---|
| powerplay | 7.13 | 123 |
| middle | 7.06 | 188 |
| death | 8.45 | 200 |
Based on 44 matches.
ODI
- Par score
- 242
- Toss winner won
- 40%
- Chose to field
- 75%
- Bat-first won
- 43%
Last first innings: 203/10, 36/5, 297/6, 113/10, 212/6
| Phase | Run rate | Wkts |
|---|---|---|
| powerplay | 4.74 | 57 |
| middle | 4.82 | 160 |
| death | 7.14 | 85 |
Based on 27 matches.
Test
- Par score
- 353
- Toss winner won
- 17%
- Chose to field
- 62%
- Bat-first won
- 83%
Last first innings: 234/10, 298/10, 97/10, 277/10, 253/10
| Phase | Run rate | Wkts |
|---|---|---|
| first | 2.84 | 88 |
| middle | 3.13 | 108 |
| late | 3.20 | 69 |
Based on 10 matches.
T20
- Par score
- 177
- Toss winner won
- 52%
- Chose to field
- 77%
- Bat-first won
- 37%
Last first innings: 169/9, 151/7, 177/5, 98/9, 155/8
| Phase | Run rate | Wkts |
|---|---|---|
| powerplay | 8.36 | 174 |
| middle | 7.76 | 236 |
| death | 10.34 | 193 |
Based on 55 matches.
List A
- Par score
- 283
- Toss winner won
- 0%
- Chose to field
- 67%
- Bat-first won
- 50%
Last first innings: 253/9, 365/7, 283/10
Based on 3 matches.
First-class
- Par score
- 240
- Toss winner won
- 50%
- Chose to field
- 75%
- Bat-first won
- 33%
Last first innings: 220/10, 240/10, 186/10, 480/10
Based on 4 matches.
T10
- Par score
- 102
- Toss winner won
- 55%
- Chose to field
- 73%
- Bat-first won
- 43%
Last first innings: 74/7, 76/8, 66/4, 131/4, 102/6
Based on 30 matches.
Top players at Daren Sammy National Cricket Stadium
T20I
- Most runs
 Mitchell Marsh264
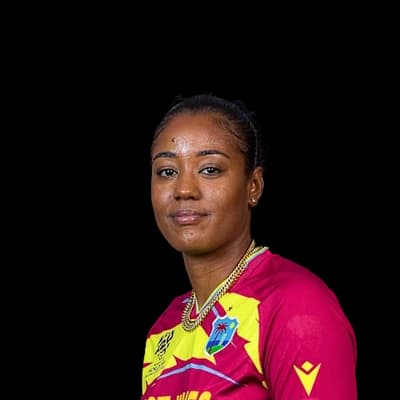 Hayley Matthews242
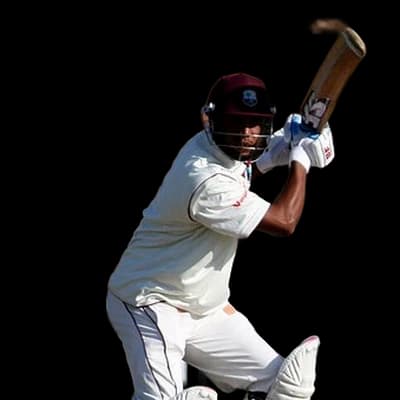 Lendl Simmons230
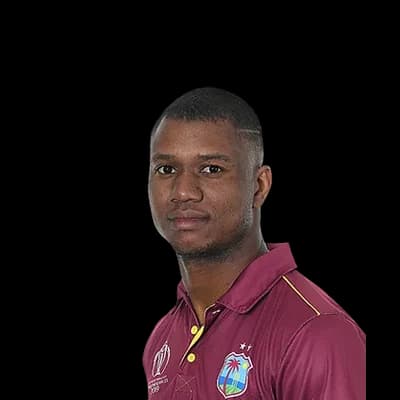 Evin Lewis210
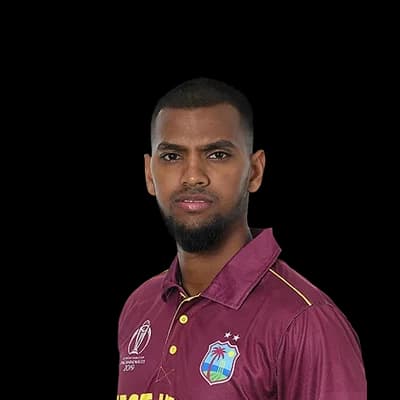 Nicholas Pooran197
- Most wickets
 Hayden Walsh12
 Saeed Ajmal11
- Hayley Matthews11
- Mitchell Marsh8
- Obed McCoy8
ODI
- Most runs
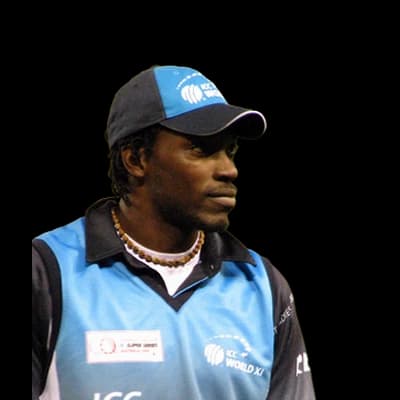 Chris Gayle464
 Misbah ul Haq307
 Marlon Samuels279
 Scott Styris263
- Lendl Simmons238
- Most wickets
 Dwayne Bravo11
- Saeed Ajmal9
 Andrew Flintoff8
 Junaid Khan7
 Jason Holder7
Test
- Most runs
 Brian Lara389
 Kraigg Brathwaite360
- Chris Gayle282
 Shivnarine Chanderpaul276
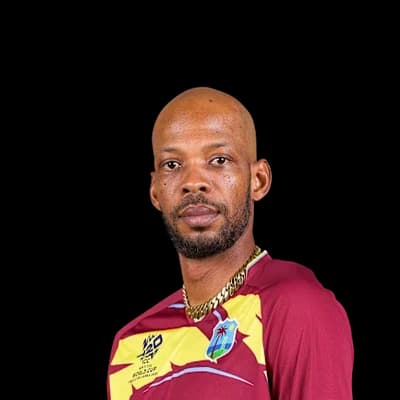 Roston Chase242
- Most wickets
 Kemar Roach29
- Shannon Gabriel23
 Alzarri Joseph12
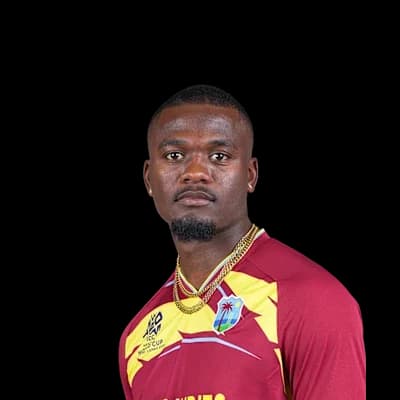 Jayden Seales11
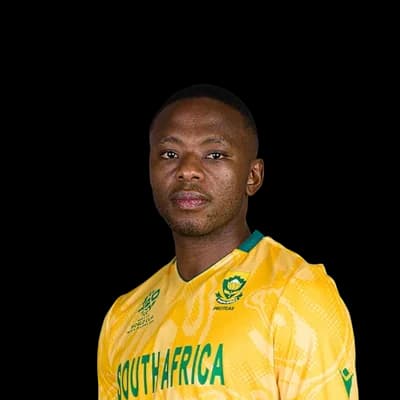 Kagiso Rabada11
T20
- Most runs
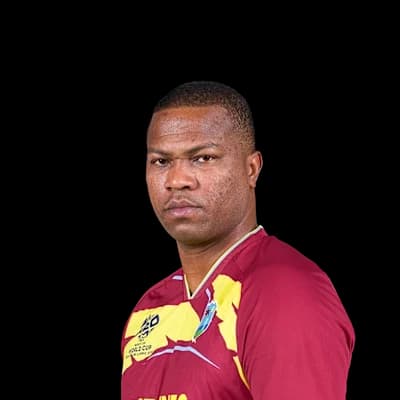 Johnson Charles1167
 Andre Fletcher939
 Kieron Pollard558
 Tim Seifert342
 Daren Sammy327
- Most wickets
 Matthew Forde20
- Alzarri Joseph20
- Kesrick Williams17
- Roston Chase15
- Obed McCoy15
Photos: ICC, Adocentyn, CC BY-SA 3.0, via Wikimedia Commons, BeingFaridKhan, CC BY-SA 3.0, via Wikimedia Commons, Dannow at English Wikipedia, Public domain, via Wikimedia Commons, NAPARAZZI, CC BY-SA 2.0, via Wikimedia Commons, Evadb, Public domain, via Wikimedia Commons, Avenue, GFDL 1.2, via Wikimedia Commons, Helenabella, CC BY-SA 3.0, via Wikimedia Commons, Blnguyen, CC BY-SA 3.0, via Wikimedia Commons, p_a_h, CC BY 2.0, via Wikimedia Commons, Ukexpat, CC BY-SA 3.0, via Wikimedia Commons, Harrias, CC BY-SA 3.0, via Wikimedia Commons, paddynapper, CC BY-SA 2.0, via Wikimedia Commons
Weather at Daren Sammy National Cricket Stadium
28°C
mostly clear
Feels 30°C · Humidity 81% · Wind 22 km/h · Cloud 30%
Rain outlook: no rain expected
Dew: unlikely – No dew expected this evening.
| Month | High | Low | Rain mm | Rain days |
|---|---|---|---|---|
| January | 28° | 24° | 67.6 | 19.1 |
| February | 28° | 24° | 51.1 | 14.8 |
| March | 28° | 24° | 55.1 | 17.2 |
| April | 29° | 25° | 45 | 15.1 |
| May | 30° | 26° | 63.4 | 16.9 |
| June | 30° | 26° | 107.9 | 22.4 |
| July | 29° | 26° | 130.1 | 26.5 |
| August | 30° | 26° | 116.5 | 23.6 |
| September | 31° | 26° | 105.5 | 18.8 |
| October | 30° | 26° | 107.3 | 20.7 |
| November | 29° | 25° | 112.9 | 20.4 |
| December | 28° | 25° | 71.7 | 19 |
Team records at Daren Sammy National Cricket Stadium
| Team | Format | P | W | L | Win % | Avg | Highest |
|---|---|---|---|---|---|---|---|
| St Lucia Kings | T20 | 20 | 10 | 9 | 50% | 163 | 206 |
| West Indies | ODI | 18 | 5 | 10 | 28% | 201 | 294 |
| St Lucia Zouks | T20 | 17 | 7 | 8 | 41% | 145 | 179 |
| West Indies | T20I | 14 | 7 | 6 | 50% | 160 | 221 |
| Whiptail Smashers | T10 | 12 | 5 | 6 | 42% | 103 | 137 |
| Australia | T20I | 11 | 6 | 5 | 55% | 163 | 197 |
| Guyana Amazon Warriors | T20 | 11 | 5 | 5 | 45% | 146 | 202 |
| Iyanola Heritage | T10 | 11 | 6 | 4 | 55% | 85 | 121 |
Recent matches at Daren Sammy National Cricket Stadium
- Caribbean Premier League 202621 Aug 2026 · T20
Jamaica Kingsmen 169/9 (20.0) · St Lucia Kings 171/4 (18.2)
- Caribbean Premier League 202619 Aug 2026 · T20
St Lucia Kings 151/7 (20.0) · Guyana Amazon Warriors 157/3 (18.1)
- Caribbean Premier League 202616 Aug 2026 · T20
Barbados Tridents 177/5 (18.0) · St Lucia Kings 168/8 (18.0)
Daren Sammy National Cricket Stadium: frequently asked questions
What is the average first-innings score at Daren Sammy National Cricket Stadium in T20Is?
The average first-innings score at Daren Sammy National Cricket Stadium in T20Is is 146, across 44 matches in our records. The par score (middle of the last 10 first innings) is 180.
Is it better to bat first or chase at Daren Sammy National Cricket Stadium?
In T20Is at Daren Sammy National Cricket Stadium, sides batting first have won 44% of decided matches (19) and chasing sides 56% (24). Evenly balanced between batting first and chasing.
What is the highest T20I total at Daren Sammy National Cricket Stadium?
The highest T20I total at Daren Sammy National Cricket Stadium is 221, and the lowest is 44.
What is the highest successful chase at Daren Sammy National Cricket Stadium in T20Is?
The highest successful T20I chase at Daren Sammy National Cricket Stadium is 221. The lowest total defended is 97.
Does the pitch at Daren Sammy National Cricket Stadium help pace or spin?
Pace bowlers have taken 55% of the wickets (with a known bowling type) in T20Is at Daren Sammy National Cricket Stadium, and spinners 45%.
What do captains choose after winning the toss at Daren Sammy National Cricket Stadium?
Captains winning the toss in T20Is at Daren Sammy National Cricket Stadium chose to field 55% of the time, and the toss winner went on to win 44% of matches.
Who has scored the most T20I runs at Daren Sammy National Cricket Stadium?
Mitchell Marsh has scored the most T20I runs at Daren Sammy National Cricket Stadium: 264 in 7 innings, averaging 37.7.
Who has taken the most T20I wickets at Daren Sammy National Cricket Stadium?
Hayden Walsh has taken the most T20I wickets at Daren Sammy National Cricket Stadium: 12 in 5 innings at an economy of 7.
More grounds in West Indies
View all →Counted from UC Cricket's own ball-by-ball records; rebuilt nightly. Weather refreshes every few minutes.