Paarl, South Africa · 153 matches on record
ODI Evenly balanced between batting first and chasing at Boland Park, based on 17 decided matches.
| Format | M | Avg 1st | Avg 2nd | Bat 1st won | Chased | Highest | Lowest | Top chase | Low defended | RR | Bdry % |
|---|---|---|---|---|---|---|---|---|---|---|---|
| T20I | 12 | 149 | 115 | 8 | 4 | 201 | 60 | 176 | 97 | 7.01 | 52.2 |
| ODI | 17 | 233 | 179 | 9 | 8 | 353 | 36 | 288 | 204 | 4.75 | 41.7 |
| T20 | 75 | 152 | 136 | 39 | 32 | 214 | 11 | 197 | 125 | 7.55 | 49.5 |
| List A | 2 | 202 | 181 | 1 | 1 | 224 | 179 | 180 | 224 | 4.30 | — |
| First-class | 2 | 538 | 506 | 0 | 1 | 642 | 304 | 416 | — | 3.80 | — |
| T10 | 25 | 88 | 73 | 16 | 9 | 121 | 50 | 107 | 70 | 8.45 | — |
Last first innings: 173/7, 201/5, 201/5, 116/6, 162/3
| Phase | Run rate | Wkts |
|---|---|---|
| powerplay | 7.12 | 35 |
| middle | 6.31 | 61 |
| death | 7.80 | 45 |
Based on 12 matches.
Last first innings: 239/9, 296/8, 287/6, 296/4, 291/7
| Phase | Run rate | Wkts |
|---|---|---|
| powerplay | 4.50 | 61 |
| middle | 4.57 | 126 |
| death | 5.89 | 78 |
Based on 17 matches.
Last first innings: 137/8, 141/6, 164/4, 160/5, 166/5
| Phase | Run rate | Wkts |
|---|---|---|
| powerplay | 7.45 | 144 |
| middle | 7.36 | 233 |
| death | 9.62 | 214 |
Based on 75 matches.
Last first innings: 82/6, 101/8, 80/2, 96/5, 83/4
Based on 25 matches.
 Amelia Kerr97
 Dane van Niekerk93
 Aiden Markram86
 Sarah Taylor74
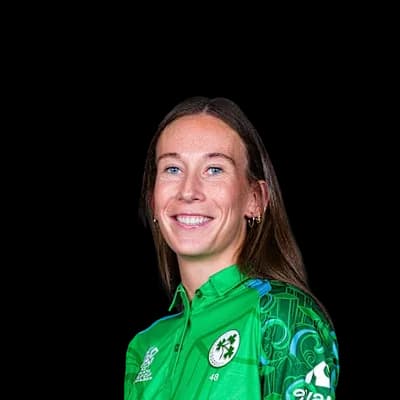 Orla Prendergast68
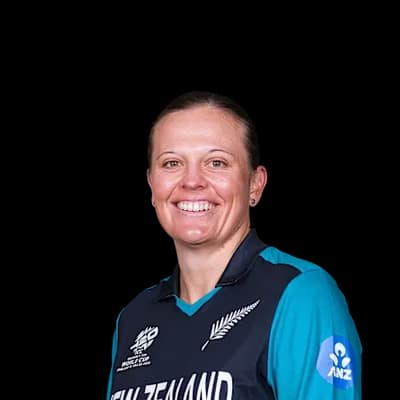 Lea Tahuhu7
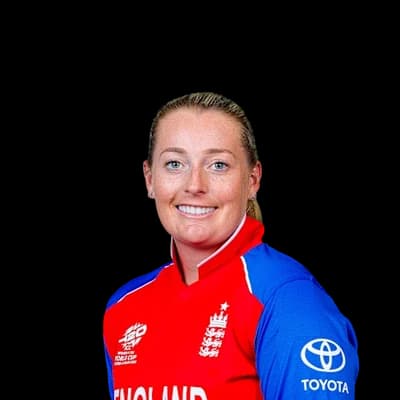 Sophie Ecclestone6
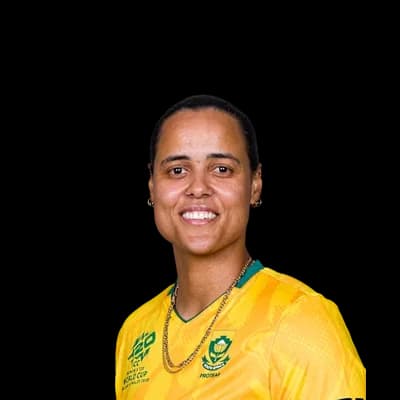 Chloe Tryon5Amelia Kerr5
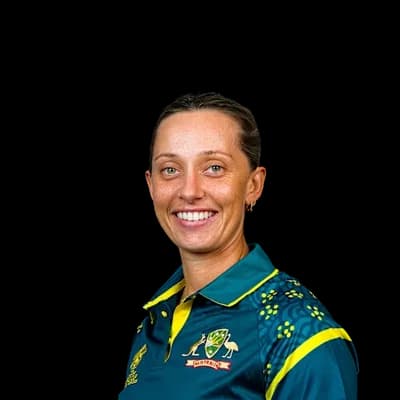 Ashleigh Gardner5
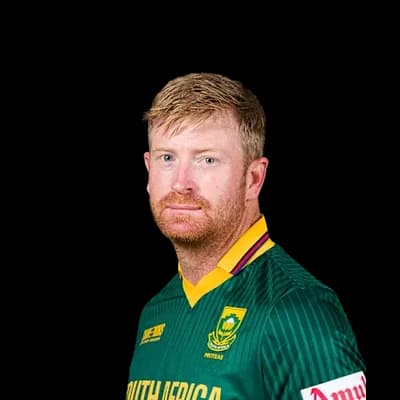 Heinrich Klaasen289
 AB de Villiers235
 Hashim Amla210
 Amy Satterthwaite189
 Quinton De Kock184
 Jos Buttler431
 David Miller426
 Lhuan dre Pretorius404
 Cameron Delport387
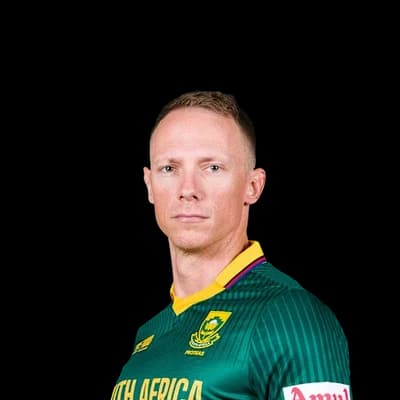 Rassie van der Dussen358
 Bjorn Fortuin33
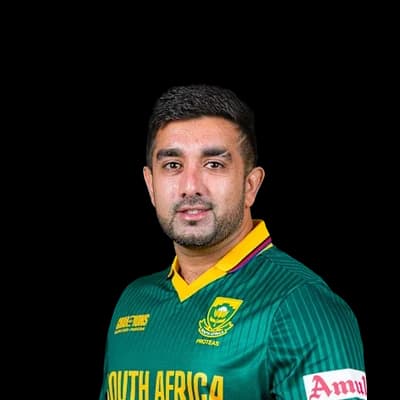 Tabraiz Shamsi27
 Dane Paterson17
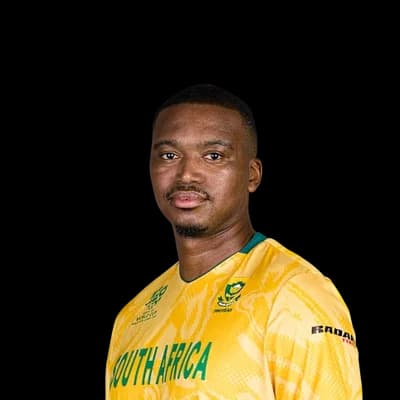 Lungisani Ngidi16Ferisco Adams14
Photos: ICC, paddynapper, CC BY-SA 2.0, via Wikimedia Commons, YellowMonkey/Blnguyen, CC BY-SA 4.0, via Wikimedia Commons, New Zealand Government, Office of the Governor-General, CC0, via Wikimedia Commons, IPL, Dave Morton, Public domain, via Wikimedia Commons
18°C
overcast
Feels 17°C · Humidity 69% · Wind 10.8 km/h · Cloud 99%
Rain outlook: no rain expected
Dew: likely – Heavy dew is likely from about 05:00; the side bowling second may find the ball wet.
| Month | High | Low | Rain mm | Rain days |
|---|---|---|---|---|
| January | 31° | 17° | 19.8 | 3 |
| February | 31° | 17° | 16 | 2.7 |
| March | 29° | 16° | 37.2 | 6 |
| April | 25° | 13° | 57.7 | 5.8 |
| May | 22° | 11° | 92.8 | 7.6 |
| June | 18° | 9° | 171.6 | 11.7 |
| July | 17° | 7° | 145.7 | 10.5 |
| August | 18° | 7° | 111.1 | 10.5 |
| September | 20° | 9° | 69.5 | 7.5 |
| October | 24° | 12° | 40.2 | 5.4 |
| November | 27° | 14° | 38.2 | 5 |
| December | 29° | 16° | 30.9 | 5.5 |
| Team | Format | P | W | L | Win % | Avg | Highest |
|---|---|---|---|---|---|---|---|
| Paarl Royals | T20 | 20 | 13 | 7 | 65% | 143 | 191 |
| Cape Cobras | T20 | 14 | 11 | 3 | 79% | 160 | 211 |
| Boland | T20 | 12 | 2 | 1 | 17% | 133 | 171 |
| Paarl Rocks | T20 | 11 | 7 | 4 | 64% | 162 | 202 |
| Paarl CC | T20 | 10 | 4 | 6 | 40% | 122 | 171 |
| South Africa | ODI | 10 | 6 | 3 | 60% | 269 | 353 |
| Vredenburg/Saldanha CC | T20 | 10 | 7 | 3 | 70% | 128 | 170 |
| Boland | First-class | 9 | 1 | 0 | 11% | 445 | 596 |
Titans 137/8 (20.0) · Boland 137/9 (20.0)
BOL won by superover
Boland 141/6 (20.0) · Mpumalanga Rhinos 102/9 (19.1)
BOL won by 39 runs
Boland 164/4 (20.0) · Eastern Storm 164/5 (20.0) · Eastern Storm 11/0 (1.0) · Boland 15/1 (1.0)
BOL won by superover
Knights 160/5 (20.0) · Boland 161/5 (20.0)
BOL won by 5 wickets
North West Dragons 642/4 (150.0) · Boland 596/9 (186.1)
Match Drawn
The average first-innings score at Boland Park in ODIs is 233, across 17 matches in our records. The par score (middle of the last 10 first innings) is 287.
In ODIs at Boland Park, sides batting first have won 53% of decided matches (9) and chasing sides 47% (8). Evenly balanced between batting first and chasing.
The highest ODI total at Boland Park is 353, and the lowest is 36.
The highest successful ODI chase at Boland Park is 288. The lowest total defended is 204.
Pace bowlers have taken 66% of the wickets (with a known bowling type) in ODIs at Boland Park, and spinners 34%.
Captains winning the toss in ODIs at Boland Park chose to field 47% of the time, and the toss winner went on to win 65% of matches.
Heinrich Klaasen has scored the most ODI runs at Boland Park: 289 in 4 innings, averaging 96.3.
Andile Phehlukwayo has taken the most ODI wickets at Boland Park: 10 in 6 innings at an economy of 5.02.
Counted from UC Cricket's own ball-by-ball records; rebuilt nightly. Weather refreshes every few minutes.