Durban, South Africa · 208 matches on record
ODI Batting first has the edge at Kingsmead, based on 29 decided matches.
| Format | M | Avg 1st | Avg 2nd | Bat 1st won | Chased | Highest | Lowest | Top chase | Low defended | RR | Bdry % |
|---|---|---|---|---|---|---|---|---|---|---|---|
| T20I | 27 | 156 | 140 | 13 | 13 | 226 | 68 | 191 | 125 | 8.03 | 59.2 |
| ODI | 36 | 242 | 181 | 18 | 11 | 372 | 7 | 372 | 180 | 5.04 | 47.3 |
| Test | 15 | 299 | 244 | 11 | 3 | 574 | 15 | 500 | 139 | 3.20 | 55 |
| T20 | 101 | 148 | 133 | 54 | 37 | 239 | 8 | 181 | 98 | 7.64 | 55.1 |
| List A | 8 | 198 | 136 | 5 | 2 | 272 | 90 | 244 | 144 | 4.52 | — |
| First-class | 1 | 400 | 493 | 0 | 0 | 493 | 239 | — | — | 3.52 | — |
Last first innings: 147/10, 147/10, 157/7, 157/7, 183/9
| Phase | Run rate | Wkts |
|---|---|---|
| powerplay | 7.55 | 90 |
| middle | 7.85 | 119 |
| death | 9.17 | 116 |
Based on 27 matches.
Last first innings: 297/8, 306/8, 306/8, 135/10, 209/10
| Phase | Run rate | Wkts |
|---|---|---|
| powerplay | 4.77 | 90 |
| middle | 4.68 | 284 |
| death | 6.94 | 132 |
Based on 36 matches.
Last first innings: 191/10, 367/10, 235/10, 351/10, 263/10
| Phase | Run rate | Wkts |
|---|---|---|
| first | 3.22 | 171 |
| middle | 3.11 | 174 |
| late | 3.34 | 159 |
Based on 15 matches.
Last first innings: 51/4, 116/10, 239/5, 202/4, 75/8
| Phase | Run rate | Wkts |
|---|---|---|
| powerplay | 7.48 | 298 |
| middle | 7.12 | 473 |
| death | 9.47 | 398 |
Based on 101 matches.
Last first innings: 99/10, 272/8, 144/5, 225/10, 192/10
Based on 8 matches.
 Mitchell Marsh221
 David Miller176
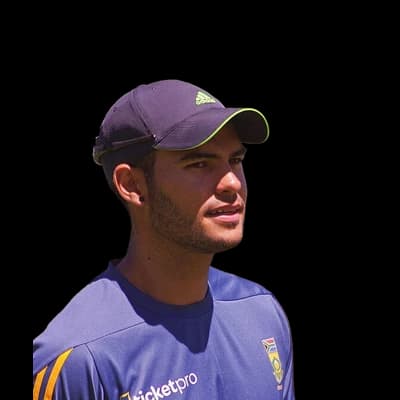 Reeza Hendricks151
 Tazmin Brits148
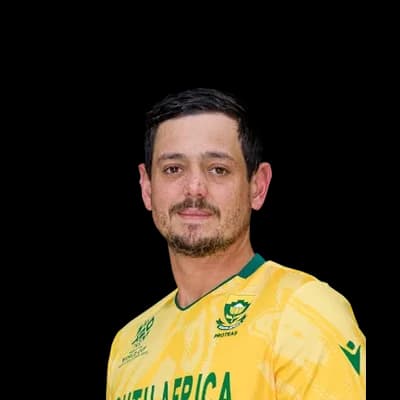 Quinton De Kock141
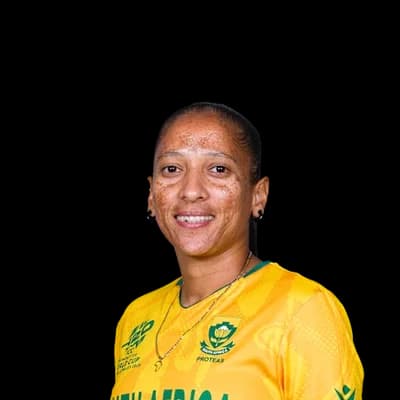 Shabnim Ismail10
 David Wiese9
 Sean Abbott8
 Irfan Pathan7
 Tumi Sekhukhune7
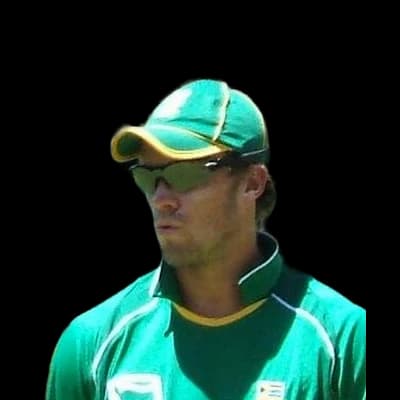 AB de Villiers596David Miller516
 Hashim Amla403
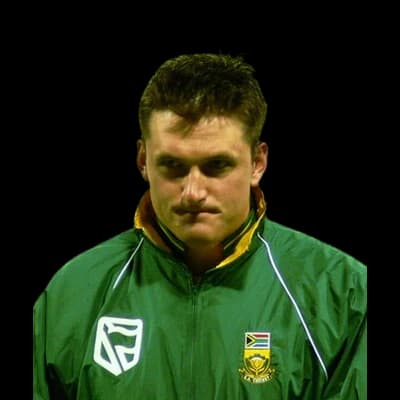 Graeme Smith384Quinton De Kock373
 Dale Steyn16
 Jacques Kallis13
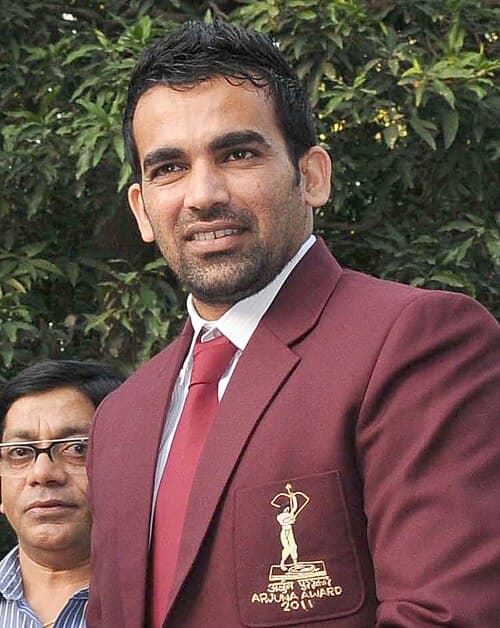 Zaheer Khan12
 Imran Tahir11AB de Villiers752Jacques Kallis635Graeme Smith539
 Temba Bavuma386Hashim Amla377Dale Steyn47
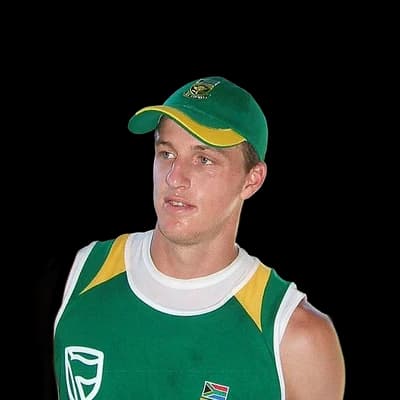 Morne Morkel28
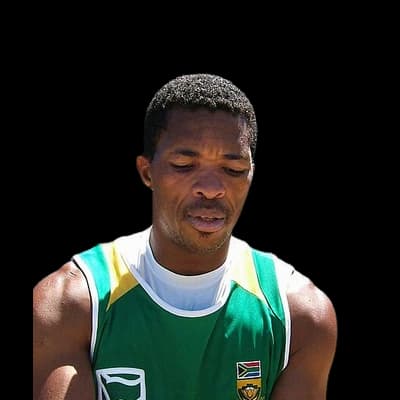 Makhaya Ntini23
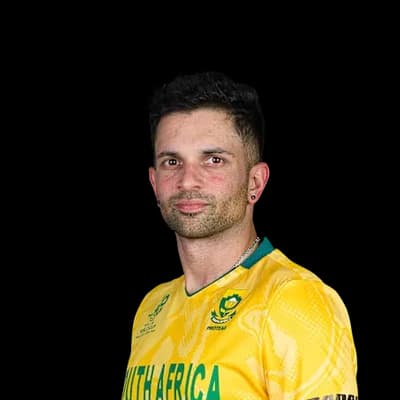 Keshav Maharaj21David Miller768
 Morne van Wyk758
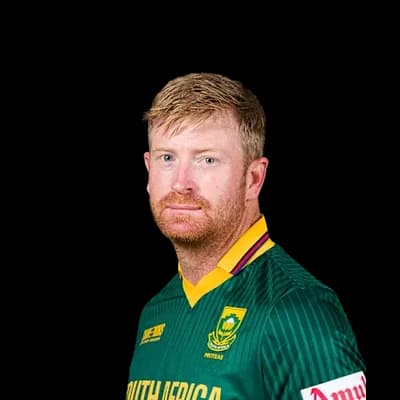 Heinrich Klaasen596Khaya Zondo591
 JJ Smuts559Keshav Maharaj53Prenelan Subrayen34Robert Frylinck29
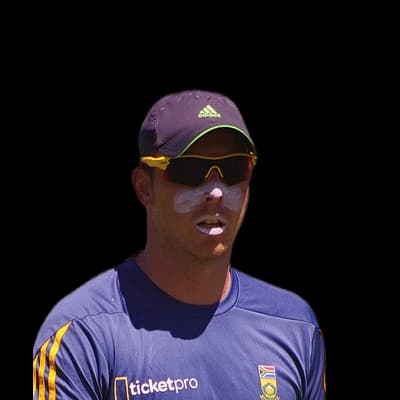 Kyle Abbott18
 Andile Phehlukwayo17
Photos: ICC, NAPARAZZI, CC BY-SA 2.0, via Wikimedia Commons, YellowMonkey/Blnguyen, CC BY-SA 4.0, via Wikimedia Commons, GraemeSmith.jpg: TonyPatterson derivative work: Bigforrap (talk), CC BY 2.0, via Wikimedia Commons, Kolkata Knight Riders - Official, CC BY 3.0, via Wikimedia Commons, Ministry of Youth Affairs and Sports, GODL-India, via Wikimedia Commons, Harrias, CC BY-SA 3.0, via Wikimedia Commons
20°C
overcast
Feels 23°C · Humidity 96% · Wind 6.3 km/h · Cloud 92%
Rain outlook: rain very likely to interrupt
Dew: likely – Heavy dew is likely from about 03:00; the side bowling second may find the ball wet.
| Month | High | Low | Rain mm | Rain days |
|---|---|---|---|---|
| January | 28° | 21° | 95.2 | 11.7 |
| February | 28° | 21° | 108.3 | 11.7 |
| March | 27° | 20° | 90.9 | 11.2 |
| April | 26° | 18° | 99.5 | 9.9 |
| May | 24° | 15° | 67 | 5.6 |
| June | 23° | 13° | 20.9 | 3.5 |
| July | 23° | 12° | 26 | 4.4 |
| August | 23° | 14° | 32.7 | 5.8 |
| September | 23° | 15° | 73.2 | 9 |
| October | 24° | 16° | 98.9 | 11.6 |
| November | 25° | 18° | 90.6 | 12.4 |
| December | 26° | 20° | 102.8 | 14 |
| Team | Format | P | W | L | Win % | Avg | Highest |
|---|---|---|---|---|---|---|---|
| Dolphins | T20 | 45 | 20 | 16 | 44% | 138 | 239 |
| South Africa | ODI | 24 | 12 | 6 | 50% | 236 | 372 |
| Durban's Super Giants | T20 | 20 | 8 | 8 | 40% | 153 | 216 |
| South Africa | Test | 16 | 6 | 8 | 38% | 256 | 556 |
| Warriors | T20 | 14 | 5 | 7 | 36% | 137 | 157 |
| Cape Cobras | T20 | 13 | 4 | 8 | 31% | 149 | 181 |
| South Africa | T20I | 13 | 6 | 7 | 46% | 149 | 202 |
| Titans | T20 | 12 | 5 | 7 | 42% | 142 | 210 |
South Western Districts 51/4 (8.0) · Dolphins 56/0 (3.5)
DOL won by 10 wickets (DLS method)
Dolphins 116/10 (18.5) · Warriors 117/4 (15.0)
WAR won by 6 wickets
Dolphins 239/5 (20.0) · Northern Cape 135/10 (16.4)
DOL won by 104 runs
Lions 202/4 (20.0) · Dolphins 194/6 (20.0)
LIO won by 8 runs
South Africa 297/8 (50.0) · Australia 230/10 (41.2)
SA won by 67 runs
The average first-innings score at Kingsmead in ODIs is 242, across 36 matches in our records. The par score (middle of the last 10 first innings) is 252.
In ODIs at Kingsmead, sides batting first have won 62% of decided matches (18) and chasing sides 38% (11). Batting first has the edge.
The highest ODI total at Kingsmead is 372, and the lowest is 7.
The highest successful ODI chase at Kingsmead is 372. The lowest total defended is 180.
Pace bowlers have taken 69% of the wickets (with a known bowling type) in ODIs at Kingsmead, and spinners 31%.
Captains winning the toss in ODIs at Kingsmead chose to field 43% of the time, and the toss winner went on to win 48% of matches.
AB de Villiers has scored the most ODI runs at Kingsmead: 596 in 13 innings, averaging 45.8.
Dale Steyn has taken the most ODI wickets at Kingsmead: 16 in 9 innings at an economy of 4.79.
Counted from UC Cricket's own ball-by-ball records; rebuilt nightly. Weather refreshes every few minutes.
