Bloemfontein, South Africa · 55 matches on record
ODI Batting first has the edge at Mangaung Oval, based on 10 decided matches.
| Format | M | Avg 1st | Avg 2nd | Bat 1st won | Chased | Highest | Lowest | Top chase | Low defended | RR | Bdry % |
|---|---|---|---|---|---|---|---|---|---|---|---|
| T20I | 3 | 143 | 118 | 3 | 0 | 195 | 41 | — | 64 | 7.97 | 51.2 |
| ODI | 11 | 280 | 236 | 6 | 4 | 399 | 78 | 347 | 198 | 5.83 | 50.7 |
| Test | 2 | 484 | 214 | 2 | 0 | 573 | 64 | — | 395 | 3.89 | 62.4 |
| T20 | 17 | 156 | 135 | 7 | 5 | 267 | 76 | 171 | 112 | 7.77 | 49.6 |
| List A | 1 | 148 | 152 | 0 | 1 | 152 | 148 | 152 | — | 4.24 | — |
Last first innings: 64/4, 169/4, 195/4
| Phase | Run rate | Wkts |
|---|---|---|
| powerplay | 7.69 | 13 |
| middle | 7.71 | 12 |
| death | 9.00 | 7 |
Based on 3 matches.
Last first innings: 260/6, 260/6, 392/8, 222/10, 342/7
| Phase | Run rate | Wkts |
|---|---|---|
| powerplay | 5.62 | 24 |
| middle | 5.59 | 86 |
| death | 7.22 | 45 |
Based on 11 matches.
Last first innings: 126/6, 186/6, 151/6, 267/3, 155/7
| Phase | Run rate | Wkts |
|---|---|---|
| powerplay | 7.64 | 45 |
| middle | 7.60 | 71 |
| death | 8.70 | 57 |
Based on 17 matches.
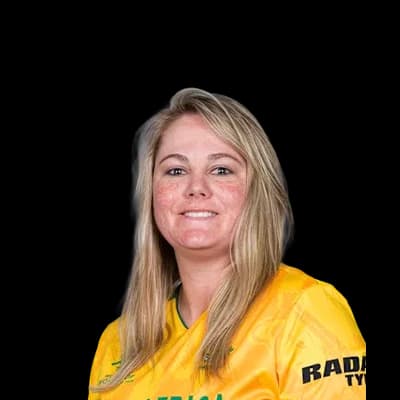 Dane van Niekerk78
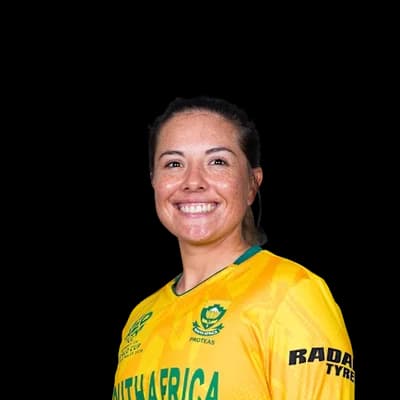 Sune Luus76
 Shamima Sultana62
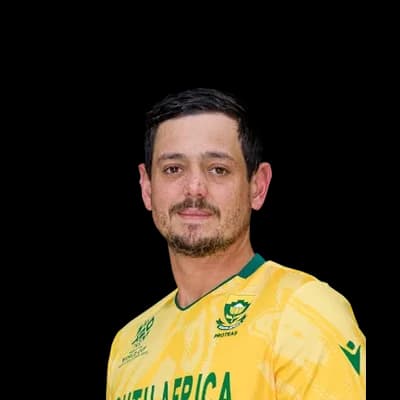 Quinton De Kock59
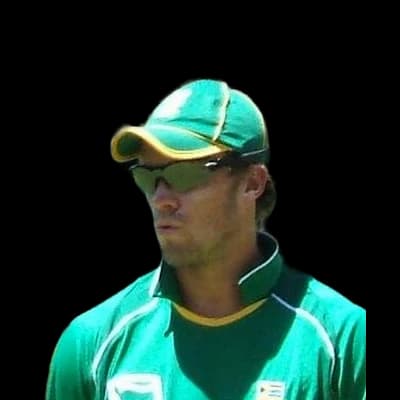 AB de Villiers49
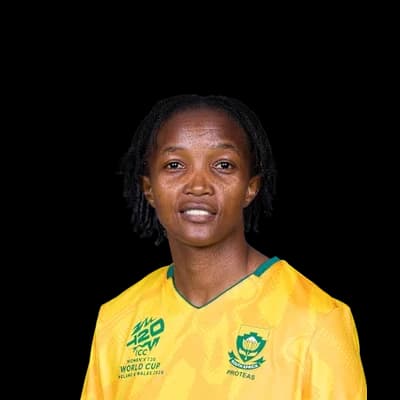 Ayabonga Khaka4
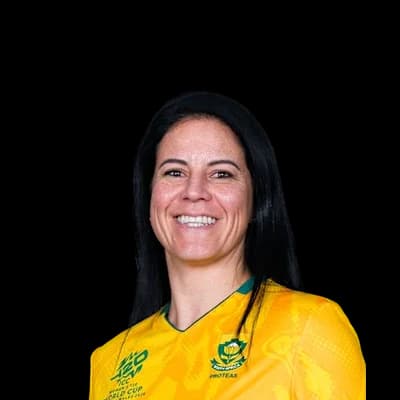 Marizanne Kapp3
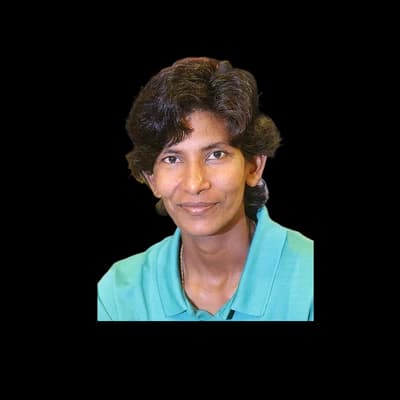 Panna Ghosh2
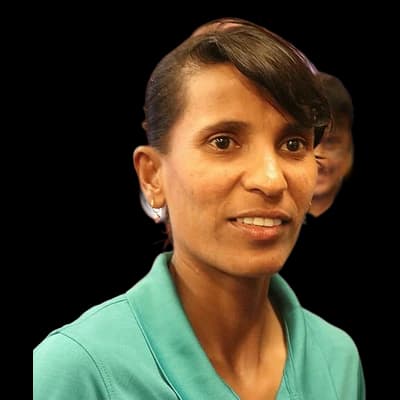 Salma Khatun2
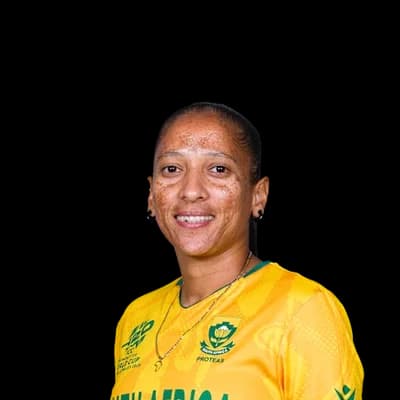 Shabnim Ismail2
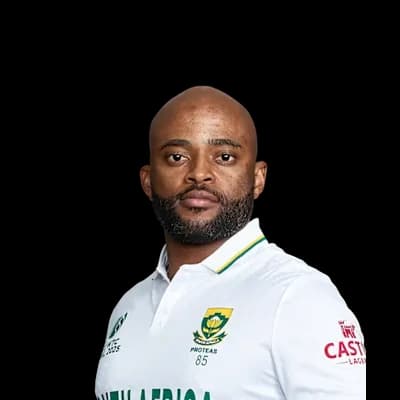 Temba Bavuma305Quinton De Kock262
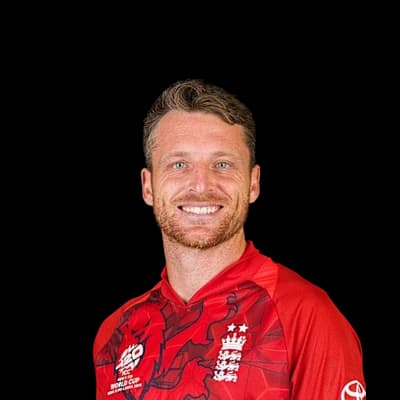 Jos Buttler235
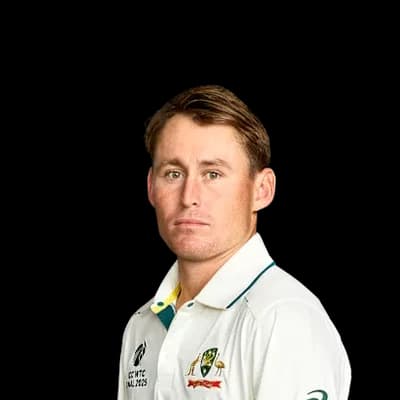 Marnus Labuschagne204
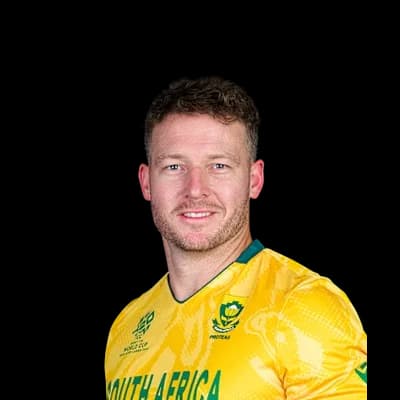 David Miller197
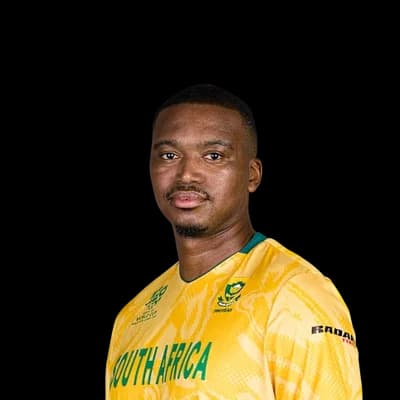 Lungisani Ngidi9
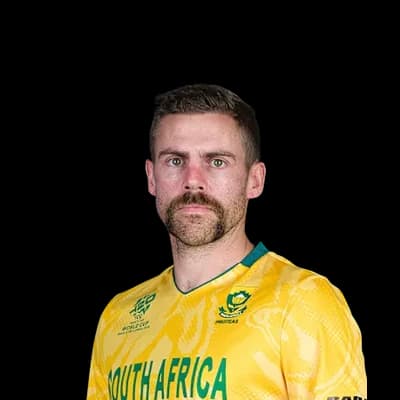 Anrich Nortje8
 Imran Tahir8
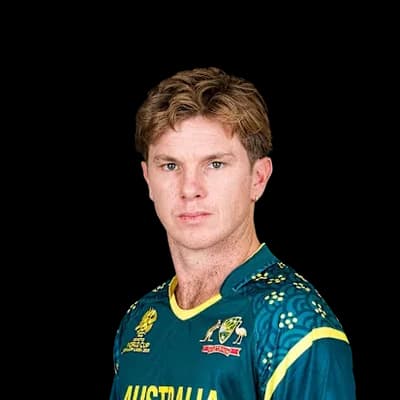 Adam Zampa7
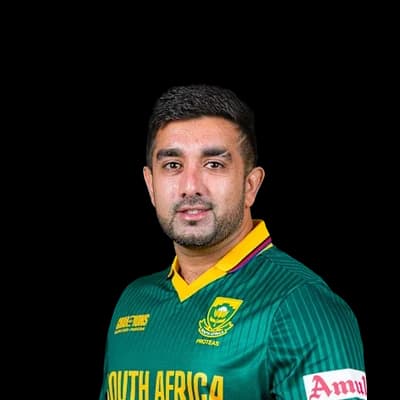 Tabraiz Shamsi6
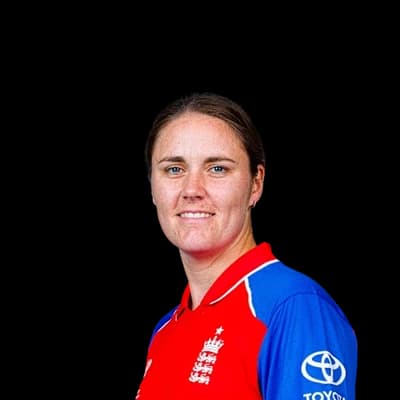 Natalie Sciver165
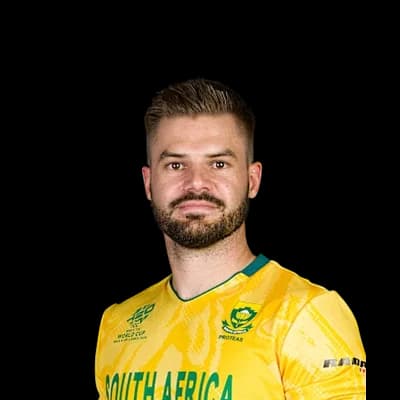 Aiden Markram143
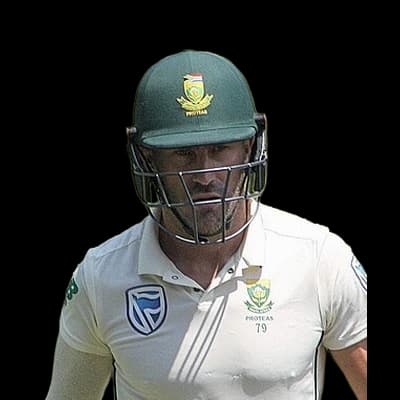 Faf du Plessis135
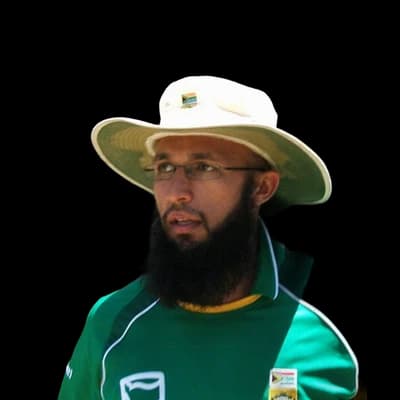 Hashim Amla132
 Maia Bouchier126
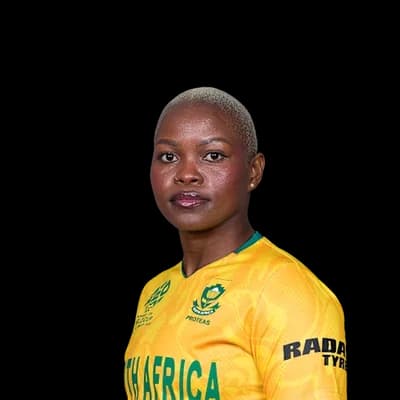 Nonkululeko Mlaba10
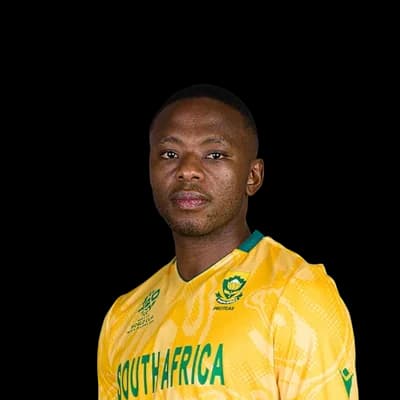 Kagiso Rabada10
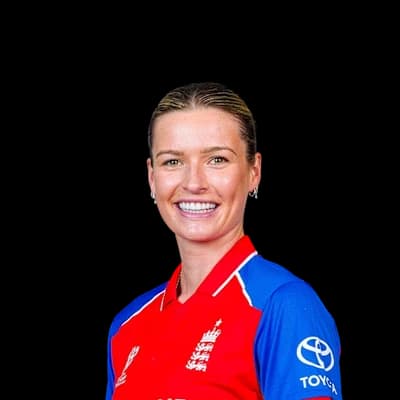 Lauren Bell8
 Duanne Olivier4
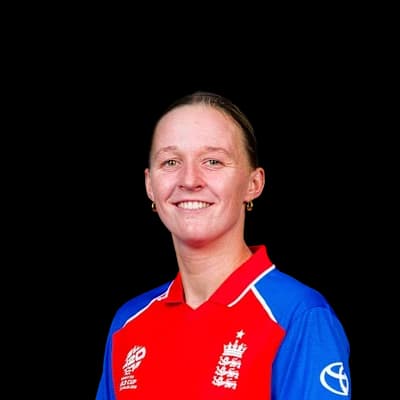 Lauren Filer3
 Lhuan dre Pretorius188
 Morne van Wyk167Theunis de Bruyn159Jacques Snyman158
 JJ Smuts107Malusi Siboto9
 Shadley van Schalkwyk8Eddie Leie7Junior Dala6Dane Piedt6
Photos: ICC, Bahnfrend, CC BY-SA 4.0, via Wikimedia Commons, YellowMonkey/Blnguyen, CC BY-SA 4.0, via Wikimedia Commons, Nurunnaby Chowdhury (Hasive), CC BY-SA 4.0, via Wikimedia Commons, Harrias, CC BY-SA 3.0, via Wikimedia Commons, Dave Morton, Public domain, via Wikimedia Commons, IPL
19°C
mostly clear
Feels 16°C · Humidity 59% · Wind 19.5 km/h · Cloud 28%
Rain outlook: no rain expected
Dew: unlikely – No dew expected this evening.
| Team | Format | P | W | L | Win % | Avg | Highest |
|---|---|---|---|---|---|---|---|
| Knights | T20 | 19 | 3 | 8 | 16% | 135 | 170 |
| South Africa | ODI | 10 | 4 | 3 | 40% | 266 | 347 |
| Knights | List A | 9 | 1 | 0 | 11% | 152 | 152 |
| Knights | First-class | 7 | 0 | 0 | 0% | — | — |
| England | ODI | 6 | 1 | 2 | 17% | 321 | 399 |
| Dolphins | T20 | 4 | 3 | 1 | 75% | 152 | 169 |
| Australia | ODI | 3 | 2 | 1 | 67% | 296 | 392 |
| Lions | T20 | 3 | 2 | 0 | 67% | 127 | 142 |
Knights 126/6 (20.0) · Mpumalanga Rhinos 92/10 (18.0)
KNT won by 34 runs
Eastern Storm 186/6 (20.0) · Knights 168/8 (20.0)
ETS won by 18 runs
Knights 151/6 (20.0) · KwaZulu-Natal Inland 154/3 (18.2)
KZNI won by 7 wickets
Titans 267/3 (20.0) · Knights 143/10 (17.2)
TIT won by 124 runs
The average first-innings score at Mangaung Oval in ODIs is 280, across 11 matches in our records. The par score (middle of the last 10 first innings) is 271.
In ODIs at Mangaung Oval, sides batting first have won 60% of decided matches (6) and chasing sides 40% (4). Batting first has the edge.
The highest ODI total at Mangaung Oval is 399, and the lowest is 78.
The highest successful ODI chase at Mangaung Oval is 347. The lowest total defended is 198.
Pace bowlers have taken 66% of the wickets (with a known bowling type) in ODIs at Mangaung Oval, and spinners 34%.
Captains winning the toss in ODIs at Mangaung Oval chose to field 64% of the time, and the toss winner went on to win 60% of matches.
Temba Bavuma has scored the most ODI runs at Mangaung Oval: 305 in 4 innings, averaging 101.7.
Lungisani Ngidi has taken the most ODI wickets at Mangaung Oval: 9 in 4 innings at an economy of 5.65.
Counted from UC Cricket's own ball-by-ball records; rebuilt nightly. Weather refreshes every few minutes.
