Johannesburg, South Africa · Capacity 34,000 · Opened 1956 · 208 matches on record
ODI Evenly balanced between batting first and chasing at The Wanderers Stadium, based on 40 decided matches.
| Format | M | Avg 1st | Avg 2nd | Bat 1st won | Chased | Highest | Lowest | Top chase | Low defended | RR | Bdry % |
|---|---|---|---|---|---|---|---|---|---|---|---|
| T20I | 40 | 176 | 150 | 20 | 20 | 283 | 60 | 236 | 114 | 8.82 | 62.5 |
| ODI | 43 | 261 | 213 | 19 | 21 | 439 | 87 | 438 | 175 | 5.56 | 52.7 |
| Test | 19 | 298 | 227 | 12 | 6 | 561 | 49 | 323 | 180 | 3.38 | 58 |
| T20 | 83 | 159 | 145 | 39 | 33 | 258 | 3 | 209 | 134 | 8.20 | 59.4 |
| List A | 3 | 275 | 184 | 2 | 0 | 310 | 68 | — | 246 | 5.27 | — |
| First-class | 2 | 151 | 407 | 1 | 1 | 558 | 63 | 256 | 63 | 3.85 | — |
Last first innings: 185/5, 185/5, 192/4, 192/4, 114/3
| Phase | Run rate | Wkts |
|---|---|---|
| powerplay | 8.37 | 129 |
| middle | 8.45 | 190 |
| death | 10.14 | 157 |
Based on 40 matches.
Last first innings: 365/9, 205/10, 205/10, 308/9, 116/10
| Phase | Run rate | Wkts |
|---|---|---|
| powerplay | 5.02 | 114 |
| middle | 5.29 | 343 |
| death | 8.10 | 156 |
Based on 43 matches.
Last first innings: 320/10, 202/10, 157/10, 400/10, 262/10
| Phase | Run rate | Wkts |
|---|---|---|
| first | 3.16 | 225 |
| middle | 3.51 | 290 |
| late | 3.52 | 165 |
Based on 19 matches.
Last first innings: 119/6, 137/5, 205/5, 81/1, 114/7
| Phase | Run rate | Wkts |
|---|---|---|
| powerplay | 7.91 | 260 |
| middle | 7.82 | 362 |
| death | 9.84 | 298 |
Based on 83 matches.
Last first innings: 270/8, 246/10, 310/6
Based on 3 matches.
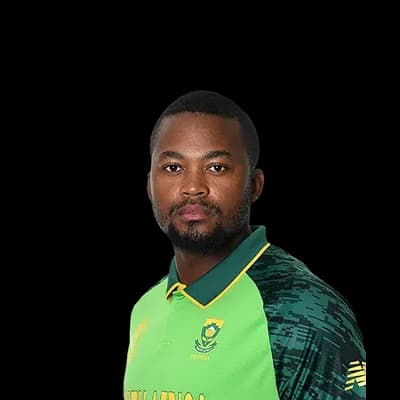
 David Miller278
 Graeme Smith270
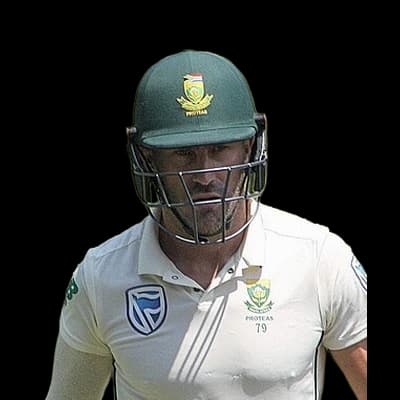 Faf du Plessis266
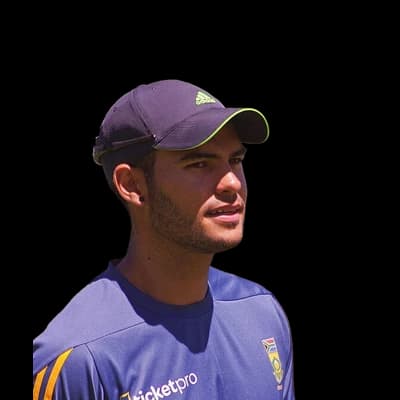 Reeza Hendricks255
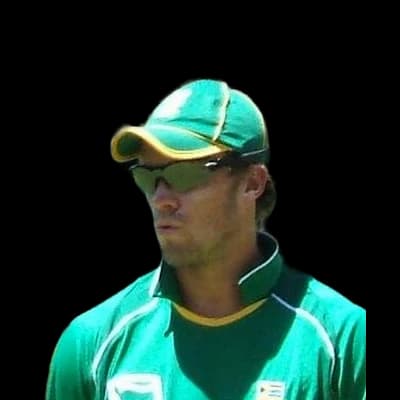 AB de Villiers236AB de Villiers732
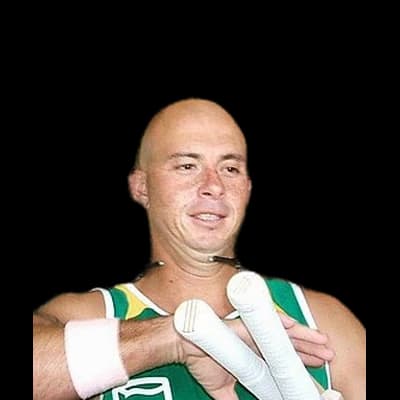 Herschelle Gibbs544
 Quinton De Kock534David Miller521
 Ricky Ponting476
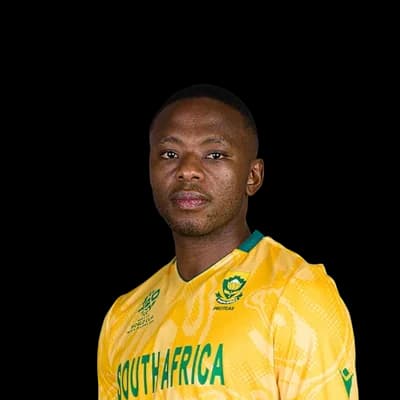 Kagiso Rabada20
 Imran Tahir11
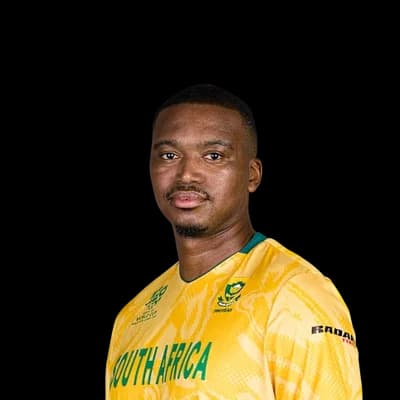 Lungisani Ngidi11
 Ayabonga Khaka10
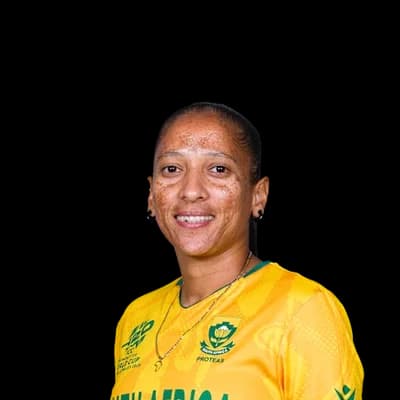 Shabnim Ismail10
 Hashim Amla1144
 Jacques Kallis768AB de Villiers753Graeme Smith741
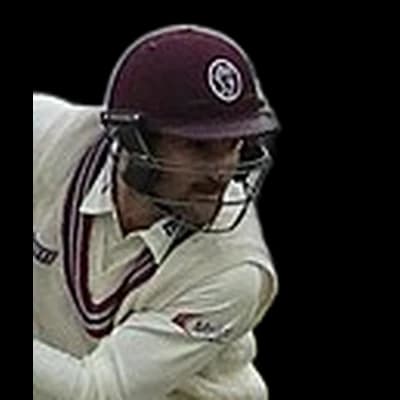 Dean Elgar694
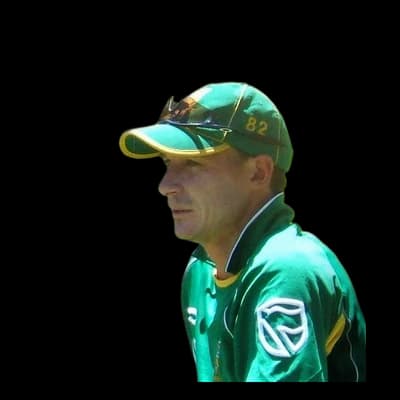 Dale Steyn48
 Vernon Philander41
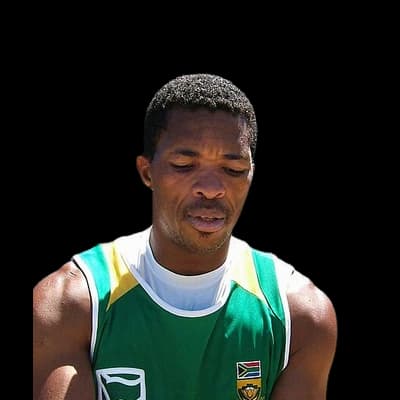 Makhaya Ntini38Kagiso Rabada34
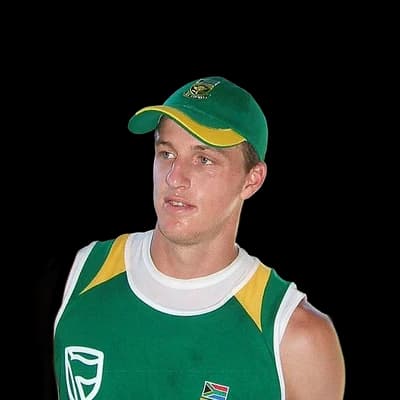 Morne Morkel29
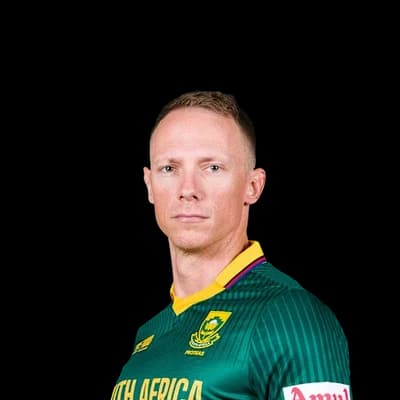 Rassie van der Dussen1271Reeza Hendricks899Faf du Plessis732Quinton De Kock609
 Temba Bavuma568
 Hardus Viljoen31Aaron Phangiso28Kagiso Rabada21Bjorn Fortuin19
 George Linde19
Photos: ICC, GraemeSmith.jpg: TonyPatterson derivative work: Bigforrap (talk), CC BY 2.0, via Wikimedia Commons, Dave Morton, Public domain, via Wikimedia Commons, NAPARAZZI, CC BY-SA 2.0, via Wikimedia Commons, YellowMonkey/Blnguyen, CC BY-SA 4.0, via Wikimedia Commons, Nurunnaby Chowdhury (Hasive), CC BY-SA 4.0, via Wikimedia Commons, Harrias, CC BY-SA 3.0, via Wikimedia Commons, Kolkata Knight Riders - Official, CC BY 3.0, via Wikimedia Commons
19°C
clear
Feels 15°C · Humidity 37% · Wind 13.9 km/h · Cloud 0%
Rain outlook: no rain expected
Dew: likely – Heavy dew is likely from about 03:00; the side bowling second may find the ball wet.
| Month | High | Low | Rain mm | Rain days |
|---|---|---|---|---|
| January | 26° | 15° | 115.1 | 14.1 |
| February | 25° | 15° | 110.3 | 13 |
| March | 24° | 14° | 74 | 9.7 |
| April | 22° | 11° | 60.3 | 8.8 |
| May | 20° | 8° | 18.7 | 2.8 |
| June | 17° | 5° | 6.9 | 1.3 |
| July | 18° | 5° | 3.1 | 0.5 |
| August | 21° | 7° | 8.1 | 1 |
| September | 25° | 10° | 15.2 | 3.8 |
| October | 26° | 12° | 43.6 | 7.7 |
| November | 26° | 14° | 86.4 | 11.4 |
| December | 26° | 15° | 114 | 15.7 |
| Team | Format | P | W | L | Win % | Avg | Highest |
|---|---|---|---|---|---|---|---|
| Lions | T20 | 36 | 18 | 11 | 50% | 147 | 223 |
| South Africa | ODI | 26 | 16 | 9 | 62% | 273 | 439 |
| South Africa | T20I | 26 | 13 | 13 | 50% | 159 | 231 |
| Joburg Super Kings | T20 | 22 | 10 | 7 | 45% | 155 | 209 |
| South Africa | Test | 21 | 11 | 7 | 52% | 279 | 561 |
| Titans | T20 | 10 | 3 | 7 | 30% | 165 | 258 |
| Jozi Stars | T20 | 9 | 2 | 7 | 22% | 168 | 239 |
| Australia | ODI | 8 | 4 | 3 | 50% | 303 | 434 |
Limpopo 119/6 (20.0) · Lions 120/2 (12.1)
LIO won by 8 wickets
Northern Cape 137/5 (20.0) · Lions 139/2 (12.0)
LIO won by 8 wickets
Lions 205/5 (20.0) · North West Dragons 207/4 (19.2)
NWD won by 6 wickets
South Africa 365/9 (50.0) · Australia 333/10 (49.5)
SA won by 32 runs
The average first-innings score at The Wanderers Stadium in ODIs is 261, across 43 matches in our records. The par score (middle of the last 10 first innings) is 299.
In ODIs at The Wanderers Stadium, sides batting first have won 48% of decided matches (19) and chasing sides 53% (21). Evenly balanced between batting first and chasing.
The highest ODI total at The Wanderers Stadium is 439, and the lowest is 87.
The highest successful ODI chase at The Wanderers Stadium is 438. The lowest total defended is 175.
Pace bowlers have taken 73% of the wickets (with a known bowling type) in ODIs at The Wanderers Stadium, and spinners 27%.
Captains winning the toss in ODIs at The Wanderers Stadium chose to field 67% of the time, and the toss winner went on to win 35% of matches.
AB de Villiers has scored the most ODI runs at The Wanderers Stadium: 732 in 11 innings, averaging 91.5.
Kagiso Rabada has taken the most ODI wickets at The Wanderers Stadium: 20 in 9 innings at an economy of 4.99.
Counted from UC Cricket's own ball-by-ball records; rebuilt nightly. Weather refreshes every few minutes.