Cape Town, South Africa · Capacity 25,000 · 189 matches on record
T20I Evenly balanced between batting first and chasing at Newlands, based on 37 decided matches.
| Format | M | Avg 1st | Avg 2nd | Bat 1st won | Chased | Highest | Lowest | Top chase | Low defended | RR | Bdry % |
|---|---|---|---|---|---|---|---|---|---|---|---|
| T20I | 38 | 156 | 138 | 17 | 20 | 220 | 90 | 192 | 119 | 7.64 | 53 |
| ODI | 26 | 259 | 207 | 18 | 8 | 367 | 54 | 259 | 201 | 5.08 | 46.8 |
| Test | 26 | 331 | 303 | 10 | 12 | 651 | 43 | 431 | 45 | 3.30 | 53.6 |
| T20 | 73 | 155 | 139 | 33 | 34 | 232 | 58 | 188 | 129 | 7.91 | 56.1 |
| List A | 7 | 187 | 175 | 1 | 3 | 274 | 92 | 274 | 256 | 4.31 | — |
| First-class | 1 | 284 | 405 | 0 | 1 | 405 | 173 | 405 | — | 3.65 | — |
Last first innings: 220/2, 220/2, 156/6, 164/4, 172/4
| Phase | Run rate | Wkts |
|---|---|---|
| powerplay | 7.19 | 96 |
| middle | 7.36 | 161 |
| death | 8.71 | 180 |
Based on 38 matches.
Last first innings: 329/10, 287/10, 258/8, 225/10, 240/8
| Phase | Run rate | Wkts |
|---|---|---|
| powerplay | 4.34 | 75 |
| middle | 4.80 | 207 |
| death | 7.24 | 119 |
Based on 26 matches.
Last first innings: 615/10, 55/10, 223/10, 269/10, 177/10
| Phase | Run rate | Wkts |
|---|---|---|
| first | 3.26 | 279 |
| middle | 3.15 | 286 |
| late | 3.55 | 263 |
Based on 26 matches.
Last first innings: 174/7, 130/7, 194/4, 168/7, 127/6
| Phase | Run rate | Wkts |
|---|---|---|
| powerplay | 7.51 | 199 |
| middle | 7.61 | 335 |
| death | 9.44 | 279 |
Based on 73 matches.
Last first innings: 269/10, 122/10, 181/7, 92/10, 241/9
Based on 7 matches.
 Laura Wolvaardt313
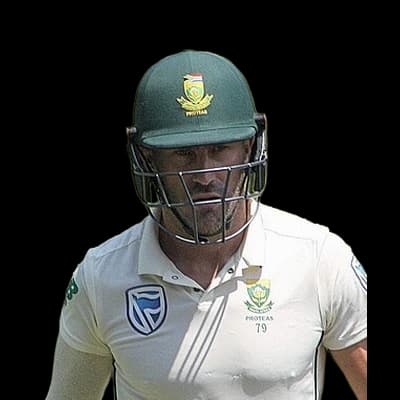 Faf du Plessis287
 Jean Paul Duminy238
 Matthew Hayden202
 David Miller200
 Imran Tahir13
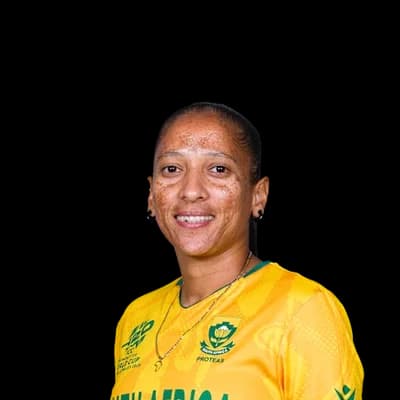 Shabnim Ismail9
 Stuart Clark9
 Nathan Bracken8
 Ayabonga Khaka7
 AB de Villiers545
 Graeme Smith439
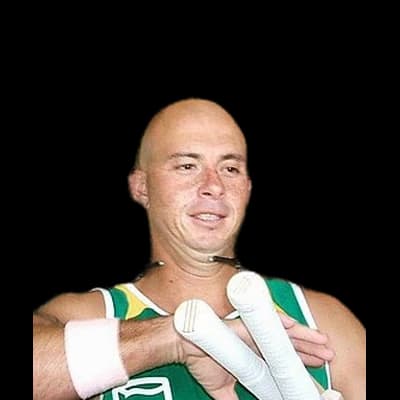 Herschelle Gibbs418
 Quinton De Kock410
 Jacques Kallis401
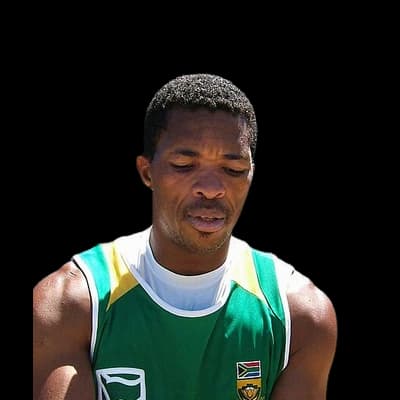 Makhaya Ntini19
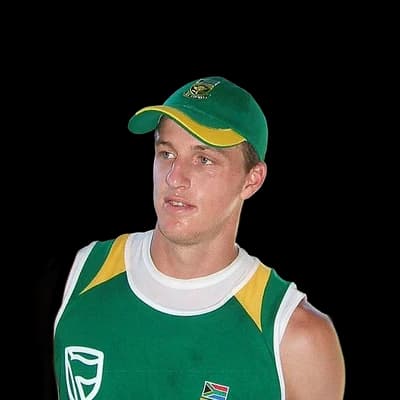 Morne Morkel13
 Shaun Pollock13
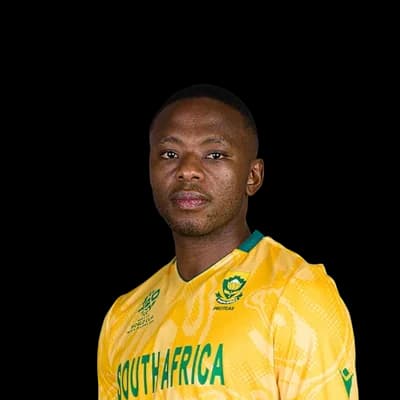 Kagiso Rabada12
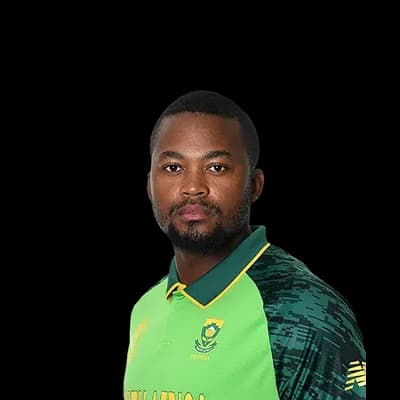 Andile Phehlukwayo10Jacques Kallis1471AB de Villiers1344
 Hashim Amla1332Graeme Smith1226
 Dean Elgar757
 Dale Steyn74
 Vernon Philander53Kagiso Rabada52Morne Morkel44Makhaya Ntini40
 Ryan Rickelton838
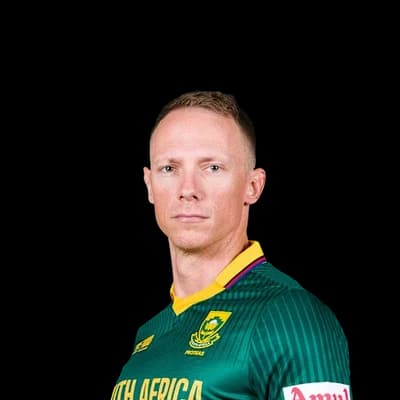 Rassie van der Dussen688
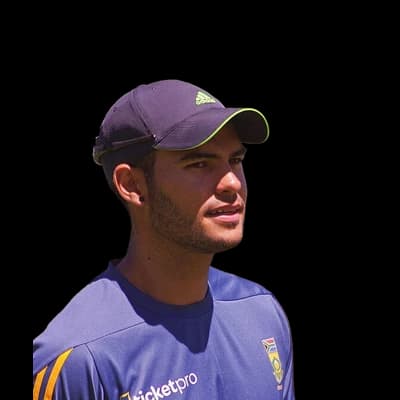 Reeza Hendricks455Quinton De Kock446
 Dewald Brevis406
 George Linde32Kagiso Rabada20
 Beuran Hendricks19
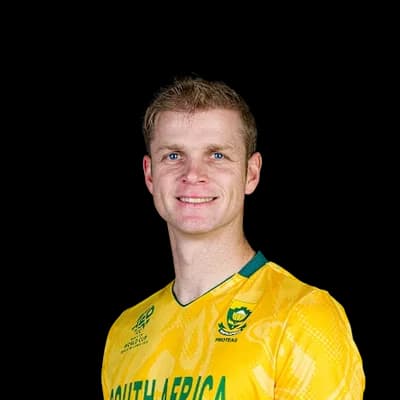 Corbin Bosch16
 Rashid Khan16
Photos: ICC, Dave Morton, Public domain, via Wikimedia Commons, NAPARAZZI, CC BY-SA 2.0, via Wikimedia Commons, Indian yogi and author Sadhguru, on Youtube, CC BY 3.0, via Wikimedia Commons, Harrias, CC BY-SA 3.0, via Wikimedia Commons, PaddyBriggs, Public domain, via Wikimedia Commons, paddynapper, CC BY-SA 2.0, via Wikimedia Commons, YellowMonkey/Blnguyen, CC BY-SA 4.0, via Wikimedia Commons, GraemeSmith.jpg: TonyPatterson derivative work: Bigforrap (talk), CC BY 2.0, via Wikimedia Commons, Kolkata Knight Riders - Official, CC BY 3.0, via Wikimedia Commons, The original uploader was Jguk at English Wikipedia., CC BY-SA 3.0, via Wikimedia Commons
18°C
overcast
Feels 17°C · Humidity 74% · Wind 10.2 km/h · Cloud 99%
Rain outlook: no rain expected
Dew: likely – Heavy dew is likely from about 22:00; the side bowling second may find the ball wet.
| Month | High | Low | Rain mm | Rain days |
|---|---|---|---|---|
| January | 26° | 18° | 13.9 | 3 |
| February | 26° | 18° | 10.4 | 2.5 |
| March | 24° | 16° | 30.1 | 4.5 |
| April | 22° | 14° | 45.2 | 5.5 |
| May | 20° | 12° | 69.9 | 7.5 |
| June | 18° | 11° | 126 | 11.5 |
| July | 17° | 10° | 108 | 9.9 |
| August | 17° | 10° | 80.8 | 10.6 |
| September | 18° | 11° | 48.6 | 7.4 |
| October | 21° | 13° | 36.9 | 6.4 |
| November | 23° | 15° | 21.6 | 5 |
| December | 24° | 16° | 27.7 | 5.2 |
| Team | Format | P | W | L | Win % | Avg | Highest |
|---|---|---|---|---|---|---|---|
| South Africa | Test | 27 | 18 | 4 | 67% | 301 | 651 |
| South Africa | ODI | 22 | 17 | 5 | 77% | 252 | 367 |
| MI Cape Town | T20 | 20 | 10 | 10 | 50% | 148 | 217 |
| Cape Cobras | T20 | 17 | 11 | 6 | 65% | 143 | 180 |
| South Africa | T20I | 14 | 4 | 9 | 29% | 159 | 192 |
| Cape Town Blitz | T20 | 11 | 5 | 6 | 45% | 161 | 183 |
| Western Province | T20 | 10 | 2 | 1 | 20% | 168 | 200 |
| Western Province | First-class | 9 | 1 | 0 | 11% | 289 | 405 |
Boland 174/7 (20.0) · Western Province 176/4 (19.5)
WP won by 6 wickets
Eastern Storm 130/7 (20.0) · Western Province 134/1 (15.5)
WP won by 9 wickets
South Africa Emerging 194/4 (20.0) · Western Province 200/4 (19.4)
WP won by 6 wickets
Knights 168/7 (20.0) · Western Province 169/5 (19.4)
WP won by 5 wickets
The average first-innings score at Newlands in T20Is is 156, across 38 matches in our records. The par score (middle of the last 10 first innings) is 172.
In T20Is at Newlands, sides batting first have won 46% of decided matches (17) and chasing sides 54% (20). Evenly balanced between batting first and chasing.
The highest T20I total at Newlands is 220, and the lowest is 90.
The highest successful T20I chase at Newlands is 192. The lowest total defended is 119.
Pace bowlers have taken 60% of the wickets (with a known bowling type) in T20Is at Newlands, and spinners 40%.
Captains winning the toss in T20Is at Newlands chose to field 37% of the time, and the toss winner went on to win 43% of matches.
Laura Wolvaardt has scored the most T20I runs at Newlands: 313 in 5 innings, averaging 104.3.
Imran Tahir has taken the most T20I wickets at Newlands: 13 in 5 innings at an economy of 6.3.
Counted from UC Cricket's own ball-by-ball records; rebuilt nightly. Weather refreshes every few minutes.


