Centurion, South Africa · Capacity 23,000 · 199 matches on record
ODI Evenly balanced between batting first and chasing at SuperSport Park, based on 44 decided matches.
| Format | M | Avg 1st | Avg 2nd | Bat 1st won | Chased | Highest | Lowest | Top chase | Low defended | RR | Bdry % |
|---|---|---|---|---|---|---|---|---|---|---|---|
| T20I | 20 | 179 | 165 | 9 | 10 | 259 | 100 | 259 | 126 | 9.50 | 65.6 |
| ODI | 47 | 257 | 217 | 19 | 25 | 416 | 11 | 319 | 183 | 5.54 | 52.1 |
| Test | 20 | 318 | 329 | 17 | 2 | 621 | 101 | 301 | 136 | 3.49 | 59.6 |
| T20 | 79 | 159 | 140 | 34 | 38 | 260 | 7 | 213 | 87 | 8.44 | 61.8 |
| List A | 4 | 199 | 179 | 1 | 2 | 286 | 145 | 181 | 286 | 5.74 | — |
| T10 | 7 | 107 | 102 | 2 | 5 | 139 | 65 | 130 | 110 | 11.60 | — |
Last first innings: 221/4, 206/5, 124/10, 219/6, 258/5
| Phase | Run rate | Wkts |
|---|---|---|
| powerplay | 9.06 | 62 |
| middle | 9.36 | 100 |
| death | 10.52 | 70 |
Based on 20 matches.
Last first innings: 361/8, 361/8, 416/5, 154/10, 314/7
| Phase | Run rate | Wkts |
|---|---|---|
| powerplay | 5.20 | 122 |
| middle | 5.17 | 322 |
| death | 7.76 | 181 |
Based on 47 matches.
Last first innings: 211/10, 245/10, 342/10, 327/10, 396/10
| Phase | Run rate | Wkts |
|---|---|---|
| first | 3.26 | 231 |
| middle | 3.61 | 289 |
| late | 3.67 | 143 |
Based on 20 matches.
Last first innings: 260/4, 143/5, 87/1, 156/6, 210/5
| Phase | Run rate | Wkts |
|---|---|---|
| powerplay | 8.05 | 260 |
| middle | 8.20 | 350 |
| death | 9.83 | 257 |
Based on 80 matches.
Last first innings: 167/8, 180/7, 163/5, 286/5
Based on 4 matches.
Last first innings: 110/7, 116/7, 65/3, 93/7, 139/0
Based on 7 matches.
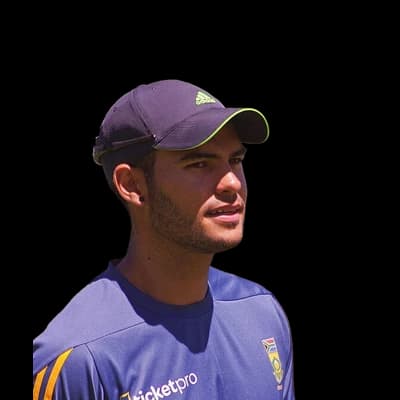 Reeza Hendricks323
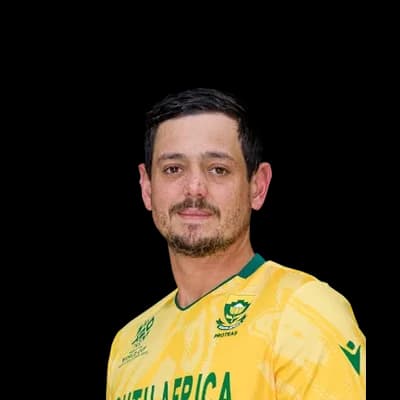 Quinton De Kock291
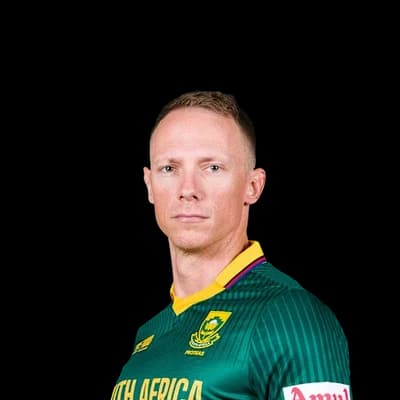 Rassie van der Dussen268
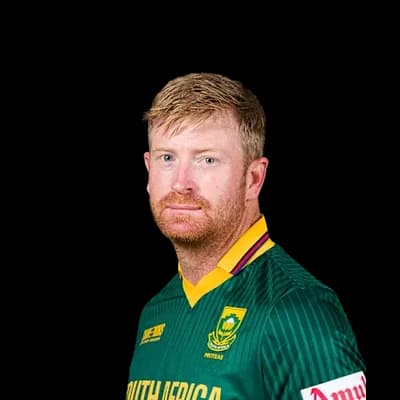 Heinrich Klaasen227
 David Miller218
 Chris Morris7
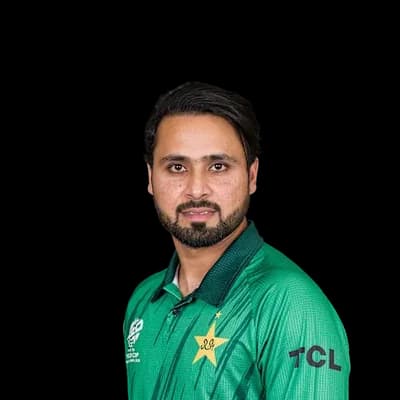 Faheem Ashraf6
 Marco Jansen5Sisanda Magala5
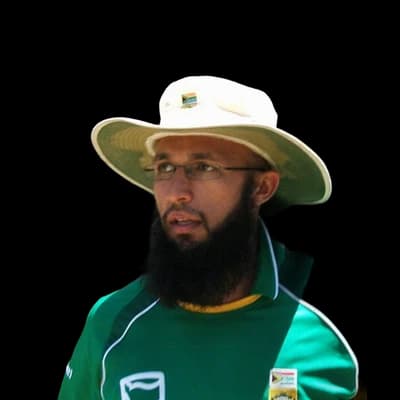 Hashim Amla904Quinton De Kock766
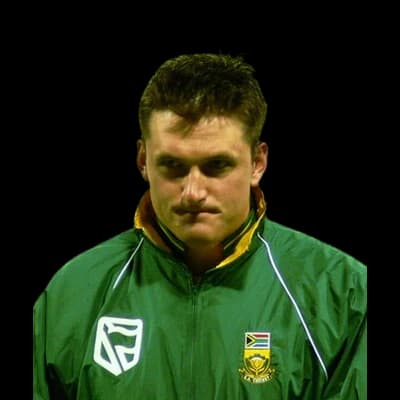 Graeme Smith762
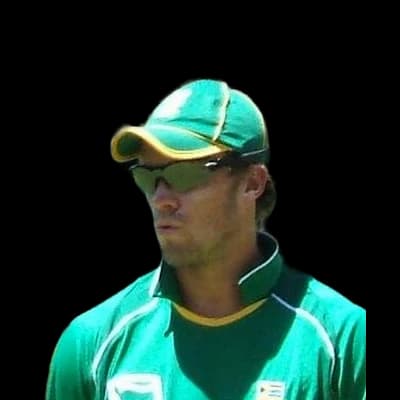 AB de Villiers637
 Jacques Kallis478
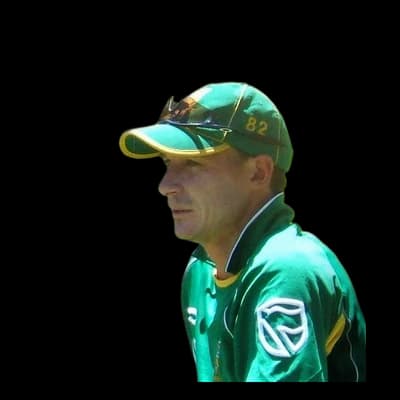 Dale Steyn24
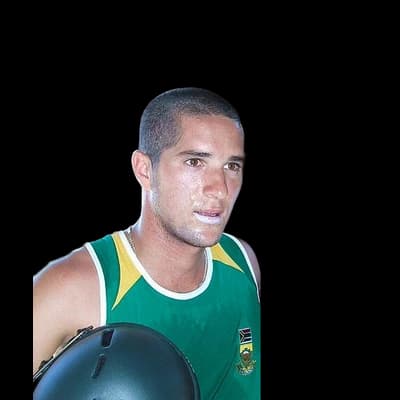 Wayne Parnell23
 Shaun Pollock14
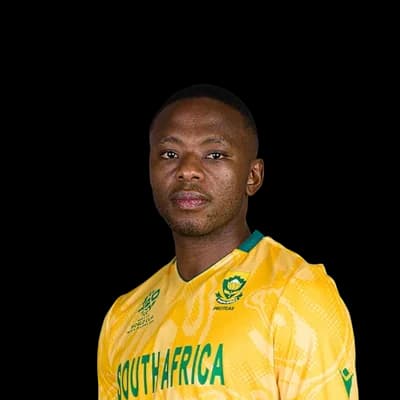 Kagiso Rabada14
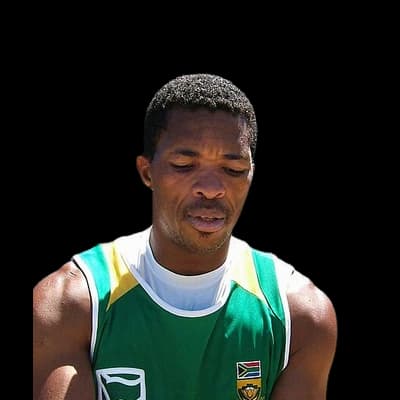 Makhaya Ntini11Hashim Amla1221AB de Villiers1040
 Dean Elgar672Jacques Kallis669Quinton De Kock547Dale Steyn59Kagiso Rabada59
 Morne Morkel32
 Vernon Philander27Makhaya Ntini21
 Farhaan Behardien496Quinton De Kock484
 Aiden Markram478
 Albie Morkel436AB de Villiers434Junior Dala23
 Tabraiz Shamsi23Malusi Siboto22
 Lungisani Ngidi22Albie Morkel19
Photos: NAPARAZZI, CC BY-SA 2.0, via Wikimedia Commons, ICC, YellowMonkey/Blnguyen, CC BY-SA 4.0, via Wikimedia Commons, GraemeSmith.jpg: TonyPatterson derivative work: Bigforrap (talk), CC BY 2.0, via Wikimedia Commons, Kolkata Knight Riders - Official, CC BY 3.0, via Wikimedia Commons, The original uploader was Jguk at English Wikipedia., CC BY-SA 3.0, via Wikimedia Commons, Dave Morton, Public domain, via Wikimedia Commons, Harrias, CC BY-SA 3.0, via Wikimedia Commons
20°C
clear
Feels 19°C · Humidity 42% · Wind 6.9 km/h · Cloud 3%
Rain outlook: no rain expected
Dew: unlikely – No dew expected this evening.
| Month | High | Low | Rain mm | Rain days |
|---|---|---|---|---|
| January | 27° | 16° | 107.5 | 13.8 |
| February | 27° | 16° | 111.4 | 12.8 |
| March | 26° | 15° | 76.6 | 9.5 |
| April | 23° | 12° | 65.8 | 7.9 |
| May | 21° | 9° | 18.5 | 2.5 |
| June | 18° | 6° | 5 | 1 |
| July | 19° | 6° | 4.1 | 1 |
| August | 22° | 8° | 4.5 | 0.8 |
| September | 26° | 12° | 15.8 | 2.8 |
| October | 27° | 13° | 46.9 | 6.9 |
| November | 27° | 15° | 89 | 10.7 |
| December | 27° | 16° | 109.2 | 15.5 |
| Team | Format | P | W | L | Win % | Avg | Highest |
|---|---|---|---|---|---|---|---|
| Titans | T20 | 36 | 17 | 11 | 47% | 148 | 260 |
| South Africa | ODI | 33 | 19 | 12 | 58% | 250 | 416 |
| South Africa | Test | 21 | 17 | 2 | 81% | 328 | 621 |
| Pretoria Capitals | T20 | 20 | 9 | 8 | 45% | 166 | 226 |
| South Africa | T20I | 17 | 8 | 9 | 47% | 177 | 259 |
| Australia | ODI | 11 | 6 | 4 | 55% | 222 | 319 |
| India | ODI | 10 | 4 | 4 | 40% | 195 | 276 |
| Pakistan | ODI | 9 | 4 | 5 | 44% | 254 | 320 |
Titans 260/4 (20.0) · Eastern Storm 161/7 (20.0)
TIT won by 99 runs
South Africa Emerging 143/5 (20.0) · Titans 147/2 (11.4)
TIT won by 8 wickets
The average first-innings score at SuperSport Park in ODIs is 257, across 47 matches in our records. The par score (middle of the last 10 first innings) is 317.
In ODIs at SuperSport Park, sides batting first have won 43% of decided matches (19) and chasing sides 57% (25). Evenly balanced between batting first and chasing.
The highest ODI total at SuperSport Park is 416, and the lowest is 11.
The highest successful ODI chase at SuperSport Park is 319. The lowest total defended is 183.
Pace bowlers have taken 74% of the wickets (with a known bowling type) in ODIs at SuperSport Park, and spinners 26%.
Captains winning the toss in ODIs at SuperSport Park chose to field 66% of the time, and the toss winner went on to win 41% of matches.
Hashim Amla has scored the most ODI runs at SuperSport Park: 904 in 15 innings, averaging 64.6.
Dale Steyn has taken the most ODI wickets at SuperSport Park: 24 in 13 innings at an economy of 4.74.
Counted from UC Cricket's own ball-by-ball records; rebuilt nightly. Weather refreshes every few minutes.
