Christchurch, New Zealand · 201 matches on record
ODI Evenly balanced between batting first and chasing at Hagley Oval, based on 26 decided matches.
| Format | M | Avg 1st | Avg 2nd | Bat 1st won | Chased | Highest | Lowest | Top chase | Low defended | RR | Bdry % |
|---|---|---|---|---|---|---|---|---|---|---|---|
| T20I | 24 | 159 | 135 | 9 | 12 | 236 | 32 | 177 | 134 | 7.80 | 54.8 |
| ODI | 28 | 255 | 204 | 13 | 13 | 356 | 99 | 275 | 131 | 5.32 | 45.5 |
| Test | 15 | 289 | 311 | 5 | 8 | 659 | 95 | 505 | 95 | 3.39 | 52.2 |
| T20 | 88 | 144 | 133 | 43 | 39 | 222 | 2 | 222 | 122 | 7.52 | 51.7 |
| List A | 5 | 183 | 178 | 2 | 3 | 257 | 68 | 207 | 233 | 4.63 | — |
| First-class | 30 | 270 | 314 | 12 | 11 | 534 | 39 | 415 | 111 | 3.20 | 53.1 |
Last first innings: 180/5, 225/4, 194/6, 187/4, 194/6
| Phase | Run rate | Wkts |
|---|---|---|
| powerplay | 7.32 | 67 |
| middle | 7.62 | 99 |
| death | 9.72 | 74 |
Based on 24 matches.
Last first innings: 268/10, 268/10, 269/7, 251/8, 220/10
| Phase | Run rate | Wkts |
|---|---|---|
| powerplay | 4.87 | 84 |
| middle | 5.02 | 207 |
| death | 7.30 | 112 |
Based on 28 matches.
Last first innings: 231/10, 348/10, 162/10, 355/10, 364/10
| Phase | Run rate | Wkts |
|---|---|---|
| first | 2.95 | 150 |
| middle | 3.55 | 195 |
| late | 3.76 | 149 |
Based on 15 matches.
Last first innings: 171/5, 146/5, 146/5, 106/10, 138/10
| Phase | Run rate | Wkts |
|---|---|---|
| powerplay | 7.37 | 249 |
| middle | 7.05 | 387 |
| death | 8.52 | 322 |
Based on 88 matches.
Last first innings: 68/10, 257/10, 149/10, 233/8, 206/10
Based on 5 matches.
Last first innings: 296/10, 138/10, 111/10, 361/9, 217/10
| Phase | Run rate | Wkts |
|---|---|---|
| first | 3.06 | 331 |
| middle | 3.26 | 330 |
| late | 3.32 | 263 |
Based on 30 matches.
 Glenn Phillips408
 Devon Conway332
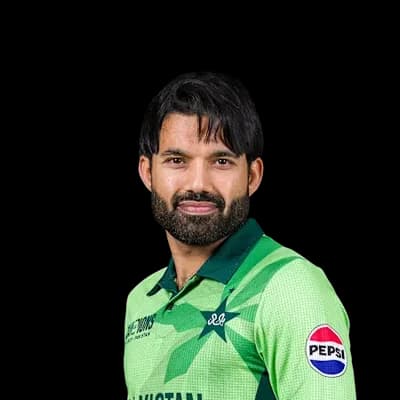 Mohammad Rizwan329
 Finn Allen255
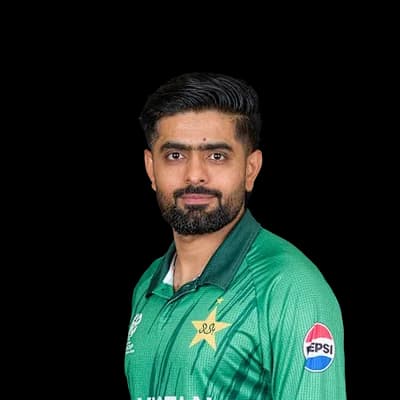 Babar Azam224
 Mitchell Santner13
 Tim Southee12
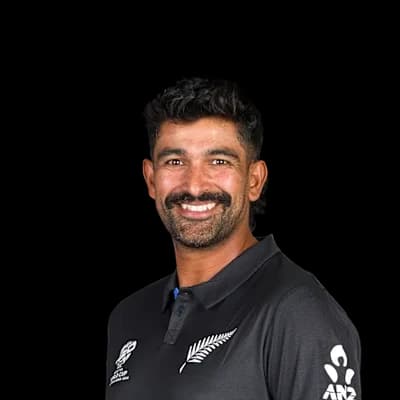 Ish Sodhi12
 Michael Bracewell12
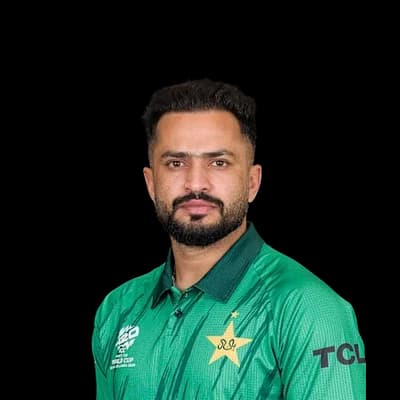 Mohammad Nawaz8
 Martin Guptill421
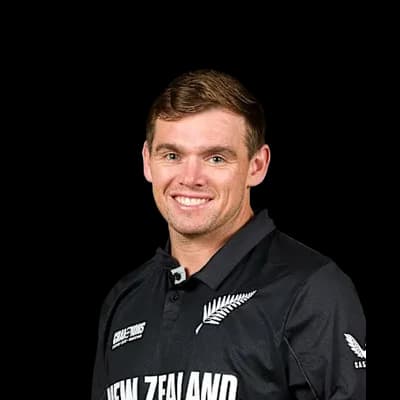 Tom Latham384
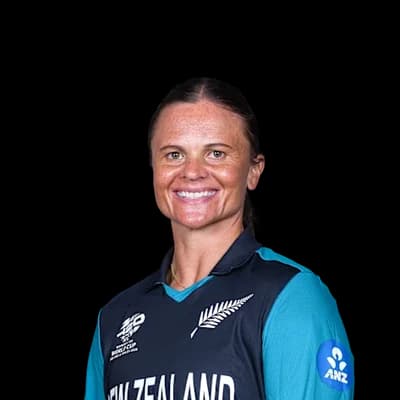 Suzie Bates333
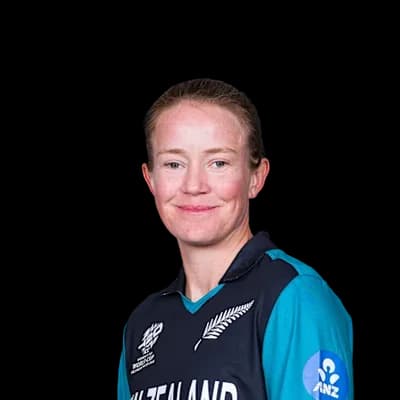 Maddy Green259
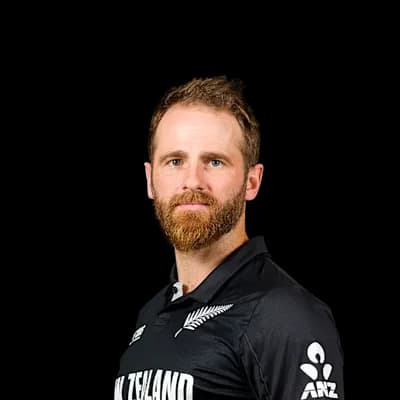 Kane Williamson251
 Trent Boult18
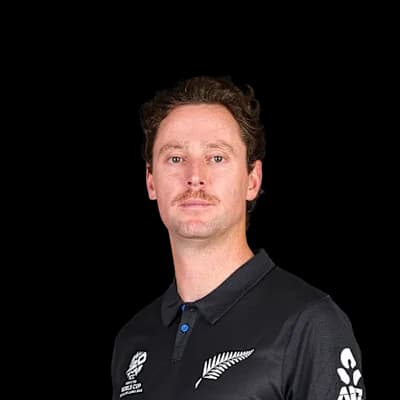 Matt Henry13
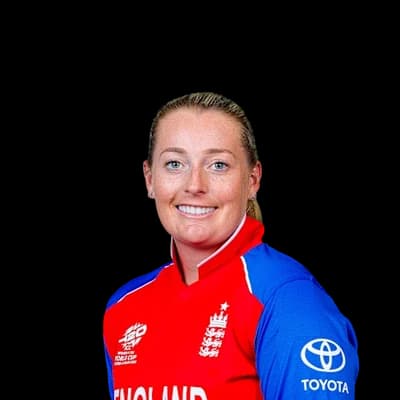 Sophie Ecclestone12Mitchell Santner11
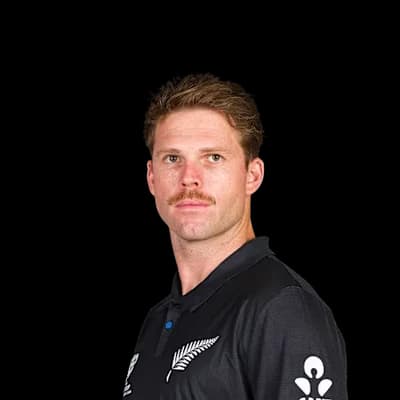 Lockie Ferguson10Tom Latham1299Kane Williamson979
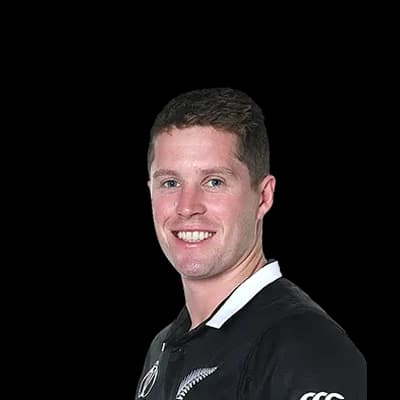 Henry Nicholls662
 Daryl Mitchell553
 Colin de Grandhomme460Tim Southee63Trent Boult53Matt Henry40
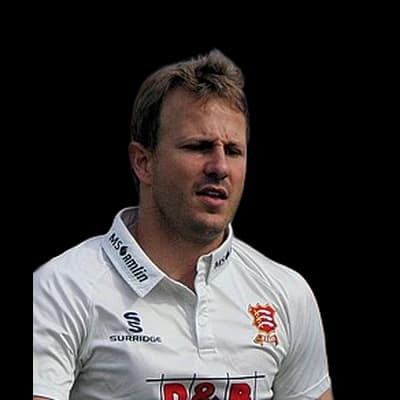 Neil Wagner37
 Kyle Jamieson28
 Chad Bowes1006
 Kate Anderson854
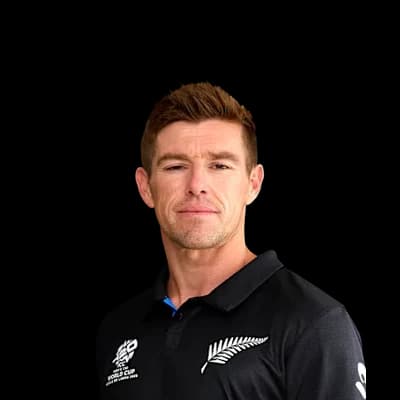 Cole McConchie768
 Amy Satterthwaite478
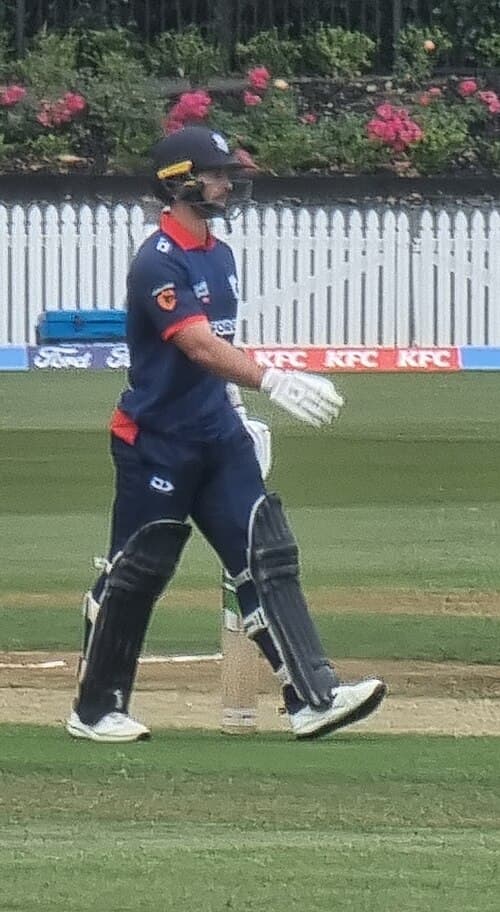 Cam Fletcher462Cole McConchie33Melissa Banks31Sarah Asmussen27Ed Nuttall25Matt Henry24
Photos: ICC, Government House, Department of the Prime Minister and Cabinet, CC0, via Wikimedia Commons, IPL, Dave Morton, Public domain, via Wikimedia Commons, New Zealand Government, Office of the Governor-General, CC0, via Wikimedia Commons, JaumeBG, CC BY-SA 4.0, via Wikimedia Commons
5°C
clear
Feels 2°C · Humidity 72% · Wind 4.9 km/h · Cloud 2%
Rain outlook: no rain expected
Dew: possible – Dew is possible from about 06:00; the side bowling second may find the ball wet.
| Month | High | Low | Rain mm | Rain days |
|---|---|---|---|---|
| January | 22° | 13° | 66.9 | 9.5 |
| February | 22° | 13° | 61.2 | 6.9 |
| March | 20° | 11° | 54.6 | 7.7 |
| April | 18° | 9° | 65.2 | 8.4 |
| May | 15° | 6° | 57.3 | 8.5 |
| June | 12° | 5° | 64.1 | 10.5 |
| July | 11° | 3° | 77.5 | 10.2 |
| August | 13° | 4° | 51.3 | 9.5 |
| September | 15° | 5° | 50.4 | 9.4 |
| October | 17° | 7° | 65.1 | 11.9 |
| November | 19° | 10° | 69.9 | 11 |
| December | 21° | 12° | 76.8 | 11.1 |
| Team | Format | P | W | L | Win % | Avg | Highest |
|---|---|---|---|---|---|---|---|
| Canterbury | T20 | 44 | 21 | 18 | 48% | 155 | 222 |
| Canterbury | T20 | 32 | 13 | 18 | 41% | 124 | 172 |
| Canterbury | First-class | 30 | 14 | 9 | 47% | 279 | 534 |
| New Zealand | Test | 16 | 9 | 4 | 56% | 310 | 659 |
| New Zealand | T20I | 15 | 6 | 6 | 40% | 157 | 225 |
| New Zealand | ODI | 13 | 11 | 1 | 85% | 234 | 341 |
| Auckland | T20 | 10 | 4 | 5 | 40% | 145 | 199 |
| Northern Districts | T20 | 9 | 3 | 5 | 33% | 154 | 219 |
New Zealand 180/5 (20.0) · India 181/6 (19.5)
IND won by 4 wickets
New Zealand 225/4 (20.0) · India 230/6 (19.4)
IND won by 4 wickets
The average first-innings score at Hagley Oval in ODIs is 255, across 28 matches in our records. The par score (middle of the last 10 first innings) is 268.
In ODIs at Hagley Oval, sides batting first have won 50% of decided matches (13) and chasing sides 50% (13). Evenly balanced between batting first and chasing.
The highest ODI total at Hagley Oval is 356, and the lowest is 99.
The highest successful ODI chase at Hagley Oval is 275. The lowest total defended is 131.
Pace bowlers have taken 69% of the wickets (with a known bowling type) in ODIs at Hagley Oval, and spinners 31%.
Captains winning the toss in ODIs at Hagley Oval chose to field 68% of the time, and the toss winner went on to win 35% of matches.
Martin Guptill has scored the most ODI runs at Hagley Oval: 421 in 8 innings, averaging 60.1.
Trent Boult has taken the most ODI wickets at Hagley Oval: 18 in 9 innings at an economy of 5.2.
Counted from UC Cricket's own ball-by-ball records; rebuilt nightly. Weather refreshes every few minutes.


