New Plymouth, New Zealand · 36 matches on record
T20 Evenly balanced between batting first and chasing at Pukekura Park, based on 27 decided matches.
| Format | M | Avg 1st | Avg 2nd | Bat 1st won | Chased | Highest | Lowest | Top chase | Low defended | RR | Bdry % |
|---|---|---|---|---|---|---|---|---|---|---|---|
| T20I | 1 | 134 | 133 | 1 | 0 | 134 | 133 | — | 134 | 6.68 | 43 |
| T20 | 27 | 161 | 148 | 13 | 14 | 228 | 54 | 228 | 79 | 8.43 | 63 |
| List A | 3 | 237 | 229 | 1 | 2 | 295 | 192 | 295 | 219 | 5.13 | — |
| First-class | 2 | 393 | 322 | 0 | 1 | 556 | 229 | 242 | — | 3.17 | 61.7 |
Last first innings: 185/4, 79/3, 150/9, 112/5, 217/9
| Phase | Run rate | Wkts |
|---|---|---|
| powerplay | 7.34 | 99 |
| middle | 8.19 | 131 |
| death | 10.74 | 119 |
Based on 27 matches.
Last first innings: 219/10, 294/7, 199/10
Based on 3 matches.
 Suzie Bates52
 Sophie Devine41
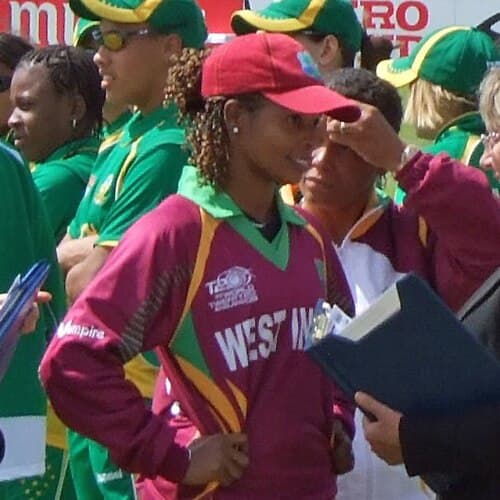 Merissa Aguilleira38
 Kycia Knight26
 Deandra Dottin24
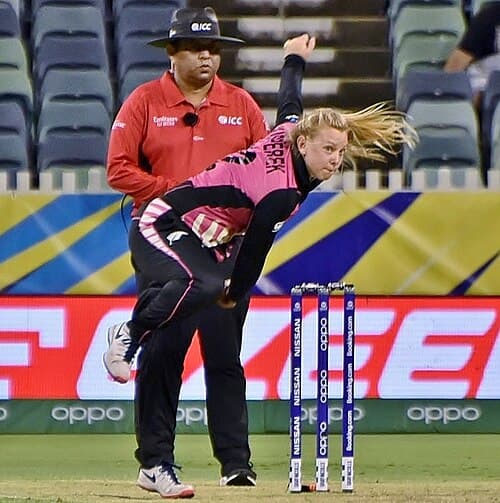 Leigh Kasperek3
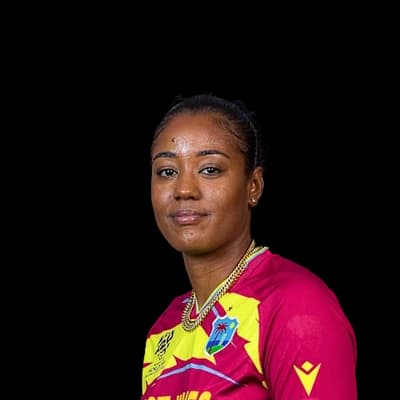 Hayley Matthews3Deandra Dottin2
 Anna Peterson2
 Amelia Kerr1
 Josh Clarkson459Dane Cleaver431George Worker407
 Tom Bruce388
 Hannah Rowe261
 Blair Tickner14Doug Bracewell13Seth Rance12Jess Watkin10
 Ajaz Patel10Dean Brownlie334Greg Hay289Tom Bruce256Stephen Murdoch146
 Will Young138Brent Arnel8Matt McEwan5Andrew Mathieson5Ajaz Patel5Doug Bracewell4
Photos: ICC, Harrias, CC BY-SA 4.0, via Wikimedia Commons, Bahnfrend, CC BY-SA 4.0, via Wikimedia Commons, Dave Morton, Public domain, via Wikimedia Commons
10°C
mostly clear
Feels 8°C · Humidity 88% · Wind 10.7 km/h · Cloud 21%
Rain outlook: small chance of a shower
Dew: likely – Heavy dew is likely from about 06:00; the side bowling second may find the ball wet.
| Team | Format | P | W | L | Win % | Avg | Highest |
|---|---|---|---|---|---|---|---|
| Central Districts | T20 | 17 | 7 | 10 | 41% | 179 | 227 |
| Central Districts | T20 | 10 | 2 | 8 | 20% | 119 | 150 |
| Auckland | T20 | 4 | 2 | 2 | 50% | 157 | 210 |
| Central Districts | List A | 4 | 1 | 0 | 25% | 201 | 201 |
| Northern Districts | T20 | 4 | 2 | 2 | 50% | 181 | 217 |
| Wellington | T20 | 4 | 3 | 1 | 75% | 179 | 228 |
| Canterbury | T20 | 3 | 2 | 1 | 67% | 86 | 114 |
| Canterbury | T20 | 3 | 2 | 1 | 67% | 197 | 221 |
Central Hinds 219/10 (47.1) · Canterbury Magicians 192/10 (46.1)
CH-W won by 27 runs
Canterbury Magicians 294/7 (50.0) · Central Hinds 295/9 (49.4)
CH-W won by 1 wicket
Wellington Firebirds 199/10 (40.5) · Central Districts 201/6 (39.2)
CS won by 4 wickets
Canterbury 185/4 (20.0) · Central Districts 142/8 (19.0)
Central Districts 79/3 (12.0) · Canterbury 54/4 (8.0)
The average first-innings score at Pukekura Park in T20s is 161, across 27 matches in our records. The par score (middle of the last 10 first innings) is 150.
In T20s at Pukekura Park, sides batting first have won 48% of decided matches (13) and chasing sides 52% (14). Evenly balanced between batting first and chasing.
The highest T20 total at Pukekura Park is 228, and the lowest is 54.
The highest successful T20 chase at Pukekura Park is 228. The lowest total defended is 79.
Pace bowlers have taken 73% of the wickets (with a known bowling type) in T20s at Pukekura Park, and spinners 27%.
Captains winning the toss in T20s at Pukekura Park chose to field 59% of the time, and the toss winner went on to win 56% of matches.
Josh Clarkson has scored the most T20 runs at Pukekura Park: 459 in 17 innings, averaging 32.8.
Blair Tickner has taken the most T20 wickets at Pukekura Park: 14 in 14 innings at an economy of 9.27.
Counted from UC Cricket's own ball-by-ball records; rebuilt nightly. Weather refreshes every few minutes.
