Mount Maunganui, New Zealand · Opened 2005 · 119 matches on record
ODI Evenly balanced between batting first and chasing at Bay Oval, based on 28 decided matches.
| Format | M | Avg 1st | Avg 2nd | Bat 1st won | Chased | Highest | Lowest | Top chase | Low defended | RR | Bdry % |
|---|---|---|---|---|---|---|---|---|---|---|---|
| T20I | 26 | 161 | 136 | 18 | 4 | 243 | 16 | 185 | 110 | 8.35 | 59.4 |
| ODI | 28 | 237 | 219 | 13 | 15 | 371 | 128 | 300 | 140 | 5.07 | 46.3 |
| Test | 6 | 421 | 367 | 5 | 1 | 615 | 42 | 458 | 325 | 3.10 | 53.4 |
| T20 | 31 | 144 | 134 | 14 | 16 | 214 | 89 | 162 | 92 | 7.30 | 52.7 |
| List A | 3 | 235 | 116 | 1 | 0 | 254 | 116 | — | 242 | 5.74 | — |
| First-class | 16 | 294 | 253 | 3 | 6 | 513 | 82 | 273 | 335 | 3.24 | 54.8 |
Last first innings: 190/7, 91/10, 190/7, 156/9, 16/1
| Phase | Run rate | Wkts |
|---|---|---|
| powerplay | 8.34 | 79 |
| middle | 8.08 | 100 |
| death | 9.04 | 95 |
Based on 26 matches.
Last first innings: 223/10, 264/8, 202/10, 140/9, 134/10
| Phase | Run rate | Wkts |
|---|---|---|
| powerplay | 4.41 | 76 |
| middle | 4.92 | 226 |
| death | 6.77 | 125 |
Based on 28 matches.
Last first innings: 575/8, 511/10, 325/9, 328/10, 431/10
| Phase | Run rate | Wkts |
|---|---|---|
| first | 2.92 | 50 |
| middle | 3.16 | 67 |
| late | 3.21 | 82 |
Based on 6 matches.
Last first innings: 166/6, 138/10, 138/10, 194/3, 154/5
| Phase | Run rate | Wkts |
|---|---|---|
| powerplay | 7.18 | 100 |
| middle | 7.30 | 151 |
| death | 7.77 | 145 |
Based on 31 matches.
Last first innings: 254/6, 242/6, 209/5
Based on 3 matches.
Last first innings: 307/10, 204/10, 427/10, 513/10, 355/10
| Phase | Run rate | Wkts |
|---|---|---|
| first | 3.15 | 180 |
| middle | 3.27 | 187 |
| late | 3.30 | 135 |
Based on 16 matches.
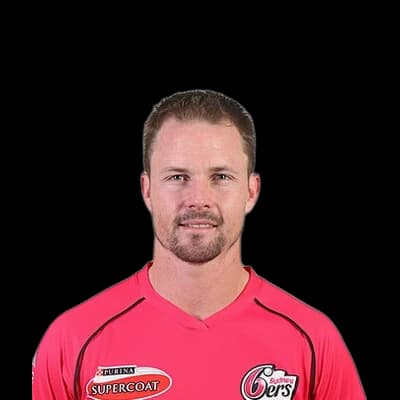 Colin Munro322
 Kane Williamson231
 Martin Guptill218
 Tim Seifert208
 Mitchell Marsh197
 Jacob Duffy14
 Ish Sodhi13
 Mitchell Santner13
 Sophie Devine10
 Tim Southee9Martin Guptill415
 Meg Lanning371
 Ross Taylor353
 Amy Satterthwaite328
 Alyssa Healy284
 Trent Boult16
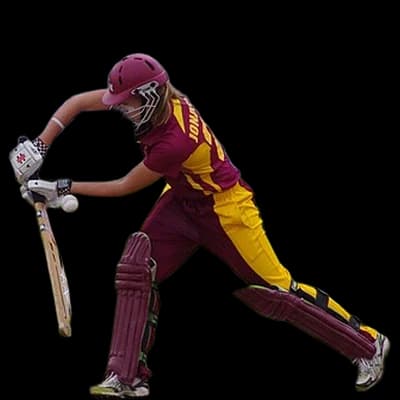 Jess Jonassen15
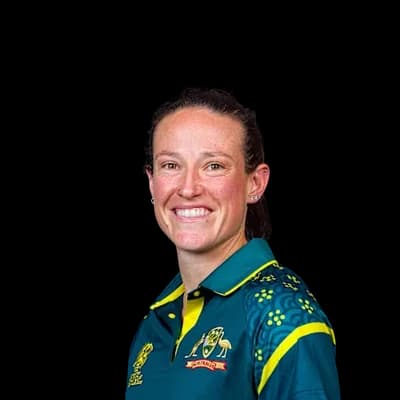 Megan Schutt11
 Matt Henry11
 Lea Tahuhu10
 Devon Conway571Kane Williamson505
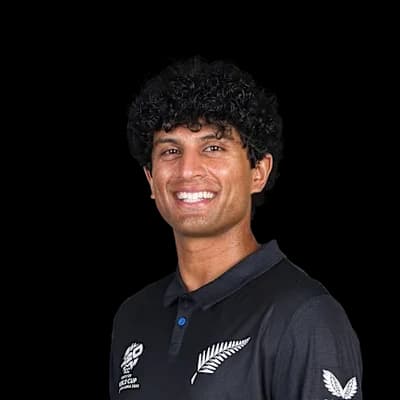 Rachin Ravindra390
 Tom Latham357
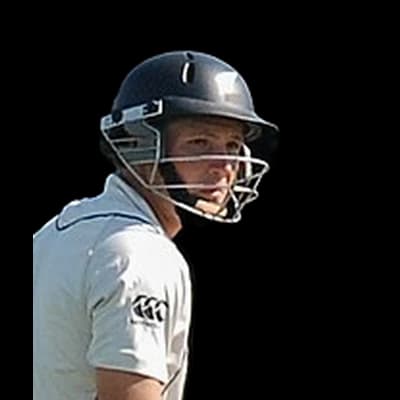 BJ Watling283
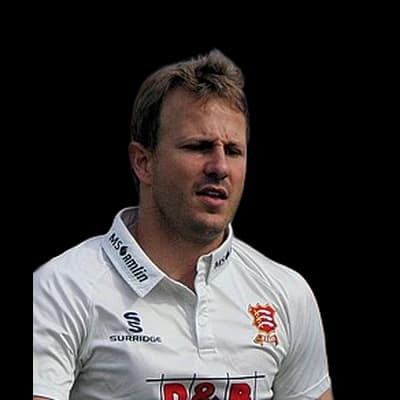 Neil Wagner21Tim Southee15
 Kyle Jamieson13Mitchell Santner11Trent Boult9Tim Seifert436
 Caitlin Gurrey319
 Brett Hampton281
 Joe Carter251Katene Dalton Clarke164Scott Kuggeleijn13
 Blair Tickner10
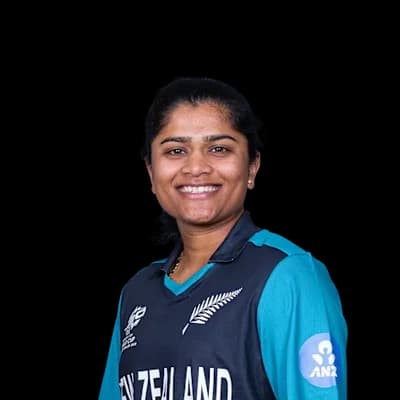 Nensi Patel10Ish Sodhi9
Photos: Joeyjackets, CC BY-SA 4.0, via Wikimedia Commons, ICC, Government House, Department of the Prime Minister and Cabinet, CC0, via Wikimedia Commons, Yu Chu Chin, CC BY-SA 4.0, via Wikimedia Commons, New Zealand Government, Office of the Governor-General, CC BY 4.0, via Wikimedia Commons, New Zealand Government, Office of the Governor-General, CC0, via Wikimedia Commons, IPL, Naparazzi, CC BY-SA 2.0, via Wikimedia Commons, DXR, CC BY-SA 4.0, via Wikimedia Commons, Dave Morton, Public domain, via Wikimedia Commons, JaumeBG, CC BY-SA 4.0, via Wikimedia Commons
10°C
clear
Feels 6°C · Humidity 82% · Wind 20 km/h · Cloud 2%
Rain outlook: no rain expected
Dew: likely – Heavy dew is likely from about 02:00; the side bowling second may find the ball wet.
| Month | High | Low | Rain mm | Rain days |
|---|---|---|---|---|
| January | 23° | 16° | 157.2 | 12.9 |
| February | 23° | 16° | 149.8 | 12.4 |
| March | 22° | 15° | 128.9 | 12 |
| April | 19° | 13° | 150.7 | 11.7 |
| May | 17° | 10° | 117.6 | 10.7 |
| June | 15° | 9° | 178 | 11.5 |
| July | 14° | 7° | 152.7 | 12.5 |
| August | 14° | 7° | 128.6 | 13 |
| September | 16° | 9° | 124.9 | 12.3 |
| October | 17° | 11° | 123.8 | 14.1 |
| November | 20° | 13° | 145 | 13.7 |
| December | 22° | 15° | 142.6 | 13.8 |
| Team | Format | P | W | L | Win % | Avg | Highest |
|---|---|---|---|---|---|---|---|
| New Zealand | T20I | 19 | 9 | 6 | 47% | 163 | 243 |
| Northern Districts | T20 | 17 | 7 | 9 | 41% | 154 | 214 |
| Northern Districts | First-class | 16 | 4 | 4 | 25% | 256 | 513 |
| New Zealand | ODI | 14 | 7 | 5 | 50% | 260 | 371 |
| Northern Districts | T20 | 12 | 4 | 8 | 33% | 117 | 140 |
| New Zealand | ODI | 9 | 1 | 8 | 11% | 210 | 270 |
| Australia | ODI | 8 | 7 | 1 | 88% | 220 | 273 |
| New Zealand | Test | 6 | 4 | 2 | 67% | 339 | 615 |
New Zealand 190/7 (20.0) · South Africa 110/7 (20.0)
New Zealand 91/10 (14.3) · South Africa 93/3 (16.4)
SA won by 7 wickets
New Zealand Women 190/7 (20.0) · South Africa Women 110/7 (20.0)
NZ-W won by 80 runs
Northern Brave Women 254/6 (50.0) · Central Hinds 0/0 ()
no result
Northern Brave Women 242/6 (28.0) · Central Hinds 116/10 (23.3)
NB-W won by 127 runs (DLS Method)
The average first-innings score at Bay Oval in ODIs is 237, across 28 matches in our records. The par score (middle of the last 10 first innings) is 223.
In ODIs at Bay Oval, sides batting first have won 46% of decided matches (13) and chasing sides 54% (15). Evenly balanced between batting first and chasing.
The highest ODI total at Bay Oval is 371, and the lowest is 128.
The highest successful ODI chase at Bay Oval is 300. The lowest total defended is 140.
Pace bowlers have taken 61% of the wickets (with a known bowling type) in ODIs at Bay Oval, and spinners 39%.
Captains winning the toss in ODIs at Bay Oval chose to field 75% of the time, and the toss winner went on to win 57% of matches.
Martin Guptill has scored the most ODI runs at Bay Oval: 415 in 10 innings, averaging 41.5.
Trent Boult has taken the most ODI wickets at Bay Oval: 16 in 8 innings at an economy of 5.59.
Counted from UC Cricket's own ball-by-ball records; rebuilt nightly. Weather refreshes every few minutes.


