Hamilton, New Zealand · Capacity 10,000 · Opened 1950 · 171 matches on record
ODI Evenly balanced between batting first and chasing at Seddon Park, based on 40 decided matches.
| Format | M | Avg 1st | Avg 2nd | Bat 1st won | Chased | Highest | Lowest | Top chase | Low defended | RR | Bdry % |
|---|---|---|---|---|---|---|---|---|---|---|---|
| T20I | 27 | 167 | 139 | 16 | 10 | 212 | 64 | 202 | 161 | 8.16 | 62.6 |
| ODI | 43 | 236 | 213 | 17 | 23 | 363 | 89 | 350 | 229 | 5.37 | 51.6 |
| Test | 16 | 333 | 335 | 8 | 6 | 715 | 21 | 520 | 231 | 3.31 | 59.2 |
| T20 | 48 | 146 | 128 | 22 | 19 | 240 | 8 | 193 | 123 | 7.79 | 56.8 |
| List A | 2 | 222 | 223 | 0 | 2 | 234 | 210 | 234 | — | 4.95 | — |
| First-class | 27 | 281 | 283 | 16 | 5 | 614 | 58 | 485 | 138 | 3.44 | 59.9 |
Last first innings: 177/5, 175/6, 177/5, 64/9, 64/9
| Phase | Run rate | Wkts |
|---|---|---|
| powerplay | 8.15 | 56 |
| middle | 7.89 | 110 |
| death | 9.35 | 98 |
Based on 27 matches.
Last first innings: 161/10, 175/10, 292/8, 255/9, 194/10
| Phase | Run rate | Wkts |
|---|---|---|
| powerplay | 4.78 | 120 |
| middle | 5.15 | 313 |
| death | 7.70 | 157 |
Based on 43 matches.
Last first innings: 347/10, 242/10, 519/7, 375/10, 234/10
| Phase | Run rate | Wkts |
|---|---|---|
| first | 3.10 | 157 |
| middle | 3.21 | 204 |
| late | 3.73 | 149 |
Based on 16 matches.
Last first innings: 240/4, 171/7, 171/7, 201/8, 8/1
| Phase | Run rate | Wkts |
|---|---|---|
| powerplay | 7.48 | 170 |
| middle | 7.54 | 220 |
| death | 8.99 | 156 |
Based on 48 matches.
Last first innings: 235/10, 346/10, 278/10, 301/9, 268/10
| Phase | Run rate | Wkts |
|---|---|---|
| first | 3.10 | 311 |
| middle | 3.51 | 350 |
| late | 3.92 | 231 |
Based on 27 matches.
 Martin Guptill374
 Kane Williamson333
 Brendon McCullum262
 Amelia Kerr235
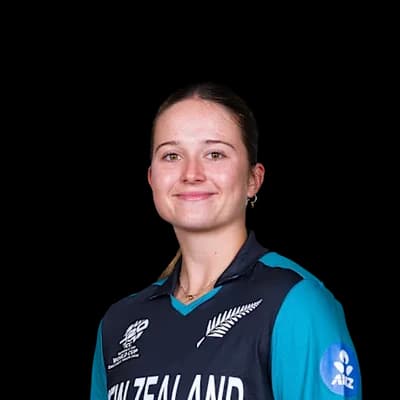 Isabella Gaze195
 Tim Southee12Amelia Kerr9
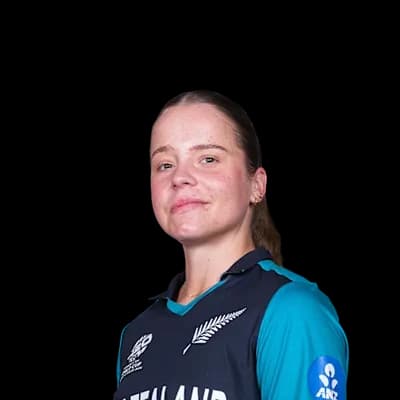 Jess Kerr9
 Nathan McCullum8
 Ish Sodhi8
 Ross Taylor886Martin Guptill779Brendon McCullum575Kane Williamson435
 Tom Latham345
 Matt Henry20
 Trent Boult18Tim Southee15Amelia Kerr12
 Mitchell Santner11Kane Williamson1614Ross Taylor1104Tom Latham728Brendon McCullum603Martin Guptill504Tim Southee54
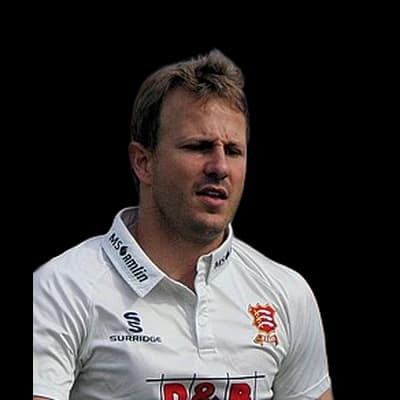 Neil Wagner41Trent Boult21
 Daniel Vettori18Chris Martin17Katene Dalton Clarke455
 Tim Seifert370
 Brett Hampton321
 Caitlin Gurrey295
 Daryl Mitchell276Scott Kuggeleijn28Ish Sodhi20Anton Devcich17Daryl Mitchell14
Photos: Government House, Department of the Prime Minister and Cabinet, CC0, via Wikimedia Commons, ICC, Ben Sutherland from Crystal Palace, London, UK, CC BY 2.0, via Wikimedia Commons, New Zealand Government, Office of the Governor-General, CC BY 4.0, via Wikimedia Commons, IPL, Dave Morton, Public domain, via Wikimedia Commons, Benchill, CC BY-SA 3.0, via Wikimedia Commons, JaumeBG, CC BY-SA 4.0, via Wikimedia Commons
8°C
clear
Feels 7°C · Humidity 90% · Wind 1.4 km/h · Cloud 2%
Rain outlook: no rain expected
Dew: likely – Heavy dew is likely from about 06:00; the side bowling second may find the ball wet.
| Team | Format | P | W | L | Win % | Avg | Highest |
|---|---|---|---|---|---|---|---|
| New Zealand | ODI | 30 | 21 | 6 | 70% | 242 | 350 |
| Northern Districts | First-class | 30 | 15 | 6 | 50% | 295 | 614 |
| Northern Districts | T20 | 28 | 19 | 5 | 68% | 159 | 240 |
| Northern Districts | T20 | 17 | 4 | 10 | 24% | 110 | 171 |
| New Zealand | Test | 16 | 10 | 4 | 62% | 313 | 715 |
| New Zealand | T20I | 15 | 11 | 2 | 73% | 180 | 212 |
| Canterbury | T20 | 9 | 3 | 6 | 33% | 168 | 228 |
| India | ODI | 9 | 2 | 5 | 22% | 208 | 347 |
Central Stags 235/10 (61.3) · Northern Districts 279/10 (102.3) · Central Stags 327/10 (99.2) · Northern Districts 258/10 (69.5)
South Africa 177/5 (20.0) · New Zealand 159/10 (19.1)
New Zealand 175/6 (20.0) · South Africa 107/10 (15.3)
NZ won by 68 runs
South Africa Women 177/5 (20.0) · New Zealand Women 159/10 (19.1)
SA-W won by 18 runs
Zimbabwe 64/9 (20.0) · New Zealand 65/0 (5.4)
The average first-innings score at Seddon Park in ODIs is 236, across 43 matches in our records. The par score (middle of the last 10 first innings) is 194.
In ODIs at Seddon Park, sides batting first have won 43% of decided matches (17) and chasing sides 57% (23). Evenly balanced between batting first and chasing.
The highest ODI total at Seddon Park is 363, and the lowest is 89.
The highest successful ODI chase at Seddon Park is 350. The lowest total defended is 229.
Pace bowlers have taken 67% of the wickets (with a known bowling type) in ODIs at Seddon Park, and spinners 33%.
Captains winning the toss in ODIs at Seddon Park chose to field 63% of the time, and the toss winner went on to win 45% of matches.
Ross Taylor has scored the most ODI runs at Seddon Park: 886 in 19 innings, averaging 55.4.
Matt Henry has taken the most ODI wickets at Seddon Park: 20 in 9 innings at an economy of 4.14.
Counted from UC Cricket's own ball-by-ball records; rebuilt nightly. Weather refreshes every few minutes.
