Napier, New Zealand · Capacity 19,700 · Opened 1910 · 100 matches on record
ODI Evenly balanced between batting first and chasing at McLean Park, based on 21 decided matches.
| Format | M | Avg 1st | Avg 2nd | Bat 1st won | Chased | Highest | Lowest | Top chase | Low defended | RR | Bdry % |
|---|---|---|---|---|---|---|---|---|---|---|---|
| T20I | 7 | 164 | 139 | 2 | 4 | 241 | 75 | 177 | 173 | 8.30 | 57.8 |
| ODI | 25 | 258 | 215 | 10 | 11 | 373 | 14 | 289 | 254 | 5.54 | 49.1 |
| Test | 4 | 398 | 249 | 2 | 0 | 619 | 51 | — | 253 | 3.22 | 56.9 |
| T20 | 32 | 151 | 127 | 17 | 15 | 230 | 75 | 186 | 136 | 7.34 | 52.5 |
| List A | 1 | 163 | 164 | 0 | 1 | 164 | 163 | 164 | — | 3.64 | — |
| First-class | 26 | 307 | 290 | 12 | 9 | 668 | 4 | 582 | 172 | 3.11 | 52.3 |
Last first innings: 134/9, 160/10, 173/5, 129/4, 173/7
| Phase | Run rate | Wkts |
|---|---|---|
| powerplay | 7.54 | 28 |
| middle | 7.98 | 30 |
| death | 10.28 | 30 |
Based on 7 matches.
Last first innings: 247/9, 344/9, 147/5, 147/5, 98/10
| Phase | Run rate | Wkts |
|---|---|---|
| powerplay | 4.72 | 53 |
| middle | 5.35 | 169 |
| death | 8.07 | 106 |
Based on 25 matches.
Last first innings: 495/8, 223/10, 619/9, 253/10
| Phase | Run rate | Wkts |
|---|---|---|
| first | 3.00 | 41 |
| middle | 2.90 | 33 |
| late | 3.61 | 44 |
Based on 4 matches.
Last first innings: 133/10, 123/5, 123/5, 142/7, 136/4
| Phase | Run rate | Wkts |
|---|---|---|
| powerplay | 6.92 | 89 |
| middle | 7.53 | 146 |
| death | 8.33 | 138 |
Based on 32 matches.
Last first innings: 373/10, 401/10, 239/10, 239/10, 251/9
| Phase | Run rate | Wkts |
|---|---|---|
| first | 2.95 | 281 |
| middle | 3.04 | 299 |
| late | 3.50 | 232 |
Based on 26 matches.
 Glenn Phillips143
 Devon Conway137
 Dawid Malan103
 Eoin Morgan91
 Mohammad Rizwan89
 Tim Southee8
 Matt Parkinson4
 Arshdeep Singh4
 Mohammed Siraj4
 Adam Milne4
 Ross Taylor707
 Brendon McCullum552
 Martin Guptill445
 Kane Williamson357
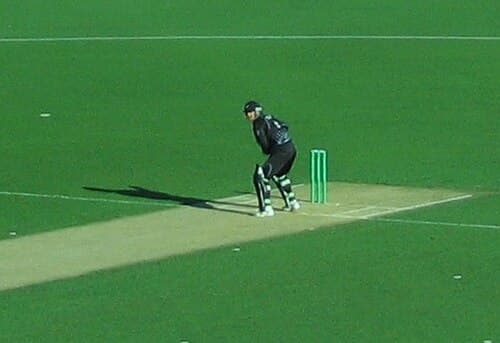 Nathan Astle240
 Daniel Vettori14
 Kyle Mills11
 Nathan Smith8
 Mohammad Shami7
 Manjula Guruge6Ross Taylor370Brendon McCullum338Daniel Vettori284
 Jesse Ryder201
 VVS Laxman200Chris Martin17Tim Southee10Daniel Vettori10
 Iain O'Brien8
 Ryan Sidebottom8
 Tom Bruce467
 Will Young370Dane Cleaver361Dean Foxcroft232
 Hannah Rowe219
 Blair Tickner26
 Ajaz Patel20Jayden Lennox12Joey Field10Hannah Rowe10
Photos: ICC, Harrias, CC BY-SA 3.0, via Wikimedia Commons, Dave Morton, Public domain, via Wikimedia Commons, BCCI, New Zealand Government, Office of the Governor-General, CC BY 4.0, via Wikimedia Commons, Ben Sutherland from Crystal Palace, London, UK, CC BY 2.0, via Wikimedia Commons, Government House, Department of the Prime Minister and Cabinet, CC0, via Wikimedia Commons, CC BY 2.0, via Wikimedia Commons, Benchill, CC BY-SA 3.0, via Wikimedia Commons, Spud770, CC BY-SA 3.0, via Wikimedia Commons, Kalyan Chakravarthy, CC BY 2.0, via Wikimedia Commons, Nic Redhead, CC BY-SA 2.0, via Wikimedia Commons
10°C
clear
Feels 6°C · Humidity 67% · Wind 17.6 km/h · Cloud 3%
Rain outlook: no rain expected
Dew: unlikely – No dew expected this evening.
| Month | High | Low | Rain mm | Rain days |
|---|---|---|---|---|
| January | 24° | 16° | 93.3 | 11 |
| February | 23° | 16° | 95.4 | 9.2 |
| March | 21° | 14° | 85.1 | 10.3 |
| April | 19° | 12° | 72.5 | 8.2 |
| May | 17° | 10° | 57.5 | 8.9 |
| June | 15° | 8° | 110.3 | 11.3 |
| July | 14° | 7° | 90.3 | 10.5 |
| August | 14° | 7° | 69.6 | 10.4 |
| September | 16° | 9° | 87.9 | 10.9 |
| October | 18° | 10° | 71.6 | 10.5 |
| November | 21° | 13° | 87.1 | 11 |
| December | 23° | 15° | 90.8 | 11.8 |
| Team | Format | P | W | L | Win % | Avg | Highest |
|---|---|---|---|---|---|---|---|
| Central Stags | First-class | 25 | 15 | 5 | 60% | 270 | 584 |
| New Zealand | ODI | 19 | 11 | 7 | 58% | 273 | 373 |
| Central Districts | T20 | 17 | 12 | 5 | 71% | 166 | 225 |
| Central Districts | T20 | 12 | 3 | 9 | 25% | 111 | 136 |
| Northern Districts | First-class | 7 | 2 | 4 | 29% | 232 | 425 |
| New Zealand | T20I | 6 | 2 | 3 | 33% | 158 | 173 |
| Otago Volts | First-class | 6 | 0 | 5 | 0% | 246 | 335 |
| Auckland Aces | First-class | 5 | 2 | 1 | 40% | 327 | 668 |
Central Stags 373/10 (104.0) · Northern Districts 82/10 (32.2) · Northern Districts 264/10 (84.0)
Wellington Firebirds 401/10 (113.3) · Central Stags 296/10 (90.4) · Wellington Firebirds 244/8 (85.0)
draw
Auckland Aces 163/10 (50.0) · Central Districts 164/5 (39.5)
CS won by 5 wickets
Otago 133/10 (18.0) · Central Districts 134/4 (19.3)
Central Districts 123/5 (20.0) · Otago 126/8 (19.3)
The average first-innings score at McLean Park in ODIs is 258, across 25 matches in our records. The par score (middle of the last 10 first innings) is 175.
In ODIs at McLean Park, sides batting first have won 48% of decided matches (10) and chasing sides 52% (11). Evenly balanced between batting first and chasing.
The highest ODI total at McLean Park is 373, and the lowest is 14.
The highest successful ODI chase at McLean Park is 289. The lowest total defended is 254.
Pace bowlers have taken 72% of the wickets (with a known bowling type) in ODIs at McLean Park, and spinners 28%.
Captains winning the toss in ODIs at McLean Park chose to field 56% of the time, and the toss winner went on to win 52% of matches.
Ross Taylor has scored the most ODI runs at McLean Park: 707 in 13 innings, averaging 78.6.
Daniel Vettori has taken the most ODI wickets at McLean Park: 14 in 9 innings at an economy of 4.53.
Counted from UC Cricket's own ball-by-ball records; rebuilt nightly. Weather refreshes every few minutes.
