Dunedin, New Zealand · Capacity 3,500 · Opened 1920 · 129 matches on record
ODI Evenly balanced between batting first and chasing at University Oval, based on 21 decided matches.
| Format | M | Avg 1st | Avg 2nd | Bat 1st won | Chased | Highest | Lowest | Top chase | Low defended | RR | Bdry % |
|---|---|---|---|---|---|---|---|---|---|---|---|
| T20I | 11 | 148 | 147 | 5 | 4 | 224 | 101 | 146 | 137 | 8.14 | 58.9 |
| ODI | 21 | 240 | 173 | 12 | 9 | 360 | 74 | 339 | 207 | 5.18 | 48.3 |
| Test | 7 | 331 | 324 | 2 | 1 | 609 | 39 | 357 | 429 | 3.17 | 57.5 |
| T20 | 50 | 148 | 143 | 11 | 33 | 231 | 25 | 191 | 94 | 8.05 | 56.7 |
| List A | 7 | 220 | 192 | 3 | 4 | 337 | 148 | 175 | 269 | 5.04 | — |
| First-class | 26 | 319 | 297 | 7 | 9 | 651 | 4 | 569 | 237 | 3.42 | 59.5 |
Last first innings: 140/10, 135/9, 101/3, 101/3, 160/4
| Phase | Run rate | Wkts |
|---|---|---|
| powerplay | 7.68 | 26 |
| middle | 8.02 | 50 |
| death | 9.47 | 36 |
Based on 11 matches.
Last first innings: 303/6, 303/6, 102/11, 102/10, 354/3
| Phase | Run rate | Wkts |
|---|---|---|
| powerplay | 4.36 | 54 |
| middle | 5.09 | 155 |
| death | 7.25 | 65 |
Based on 21 matches.
Last first innings: 308/10, 431/10, 609/9, 167/10, 238/10
| Phase | Run rate | Wkts |
|---|---|---|
| first | 2.95 | 55 |
| middle | 3.22 | 71 |
| late | 3.32 | 89 |
Based on 7 matches.
Last first innings: 231/3, 161/6, 161/6, 132/7, 143/7
| Phase | Run rate | Wkts |
|---|---|---|
| powerplay | 7.75 | 123 |
| middle | 7.61 | 191 |
| death | 9.47 | 158 |
Based on 50 matches.
Last first innings: 270/5, 162/10, 269/9, 148/10, 172/10
Based on 7 matches.
Last first innings: 156/10, 339/10, 416/7, 501/7, 411/7
| Phase | Run rate | Wkts |
|---|---|---|
| first | 3.35 | 281 |
| middle | 3.27 | 295 |
| late | 3.79 | 226 |
Based on 26 matches.
 Finn Allen175
 Suzie Bates162
 Tim Seifert158
 Maddy Green106
 Georgia Plimmer102
 Jimmy Neesham7
 Jacob Duffy6
 Mitchell Santner6
 Fatima Sana6
 Adam Milne5
 Ross Taylor505
 Kane Williamson314
 Tom Latham281
 Brooke Halliday264
 Amelia Kerr261Amelia Kerr20
 Trent Boult20
 Tim Southee11
 Corey Anderson7
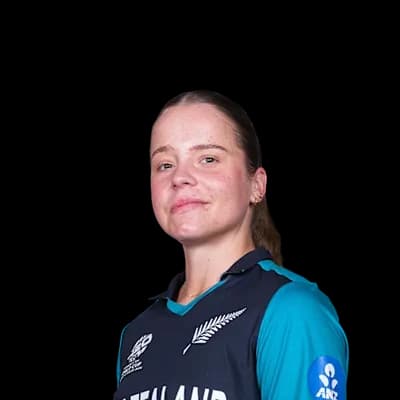 Jess Kerr7Ross Taylor547
 Brendon McCullum479Kane Williamson324
 Martin Guptill284
 Darren Bravo258
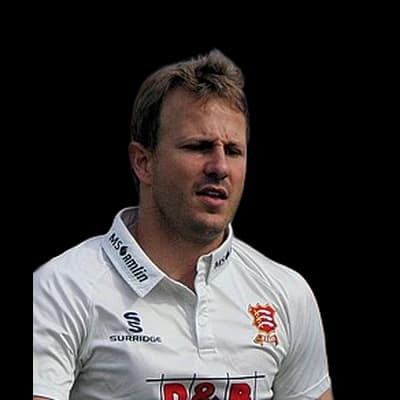 Neil Wagner20Trent Boult18Chris Martin15Tim Southee13
 Daniel Vettori10
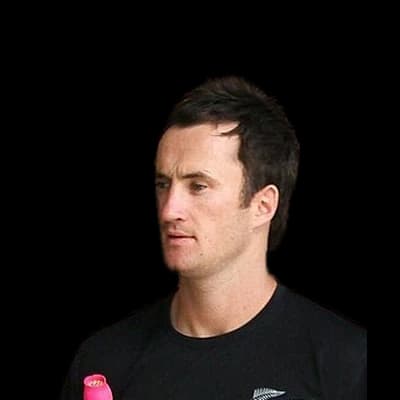 Neil Broom442Suzie Bates405Hamish Rutherford361Katene Dalton Clarke355Dean Foxcroft354
 Emma Black23Jacob Duffy14Michael Rae12
 Eden Carson12
Photos: ICC, New Zealand Government, Office of the Governor-General, CC BY 4.0, via Wikimedia Commons, IPL, Ben Sutherland from Crystal Palace, London, UK, CC BY 2.0, via Wikimedia Commons, Government House, Department of the Prime Minister and Cabinet, CC0, via Wikimedia Commons, Dave Morton, Public domain, via Wikimedia Commons, Benchill, CC BY-SA 3.0, via Wikimedia Commons, YellowMonkey/Blnguyen, CC BY-SA 4.0, via Wikimedia Commons
6°C
partly cloudy
Feels 2°C · Humidity 63% · Wind 15 km/h · Cloud 55%
Rain outlook: no rain expected
Dew: possible – Dew is possible from about 01:00; the side bowling second may find the ball wet.
| Month | High | Low | Rain mm | Rain days |
|---|---|---|---|---|
| January | 19° | 12° | 102.5 | 14.1 |
| February | 19° | 12° | 93.4 | 11.5 |
| March | 18° | 11° | 72.5 | 11.5 |
| April | 16° | 9° | 75.6 | 12.1 |
| May | 14° | 6° | 64.3 | 11.9 |
| June | 11° | 5° | 66.4 | 11.4 |
| July | 11° | 4° | 94.8 | 11 |
| August | 12° | 4° | 50.2 | 11.8 |
| September | 13° | 6° | 67.7 | 14 |
| October | 15° | 7° | 113.5 | 15.3 |
| November | 17° | 9° | 94.7 | 15.7 |
| December | 18° | 11° | 111.8 | 17 |
| Team | Format | P | W | L | Win % | Avg | Highest |
|---|---|---|---|---|---|---|---|
| Otago Volts | First-class | 30 | 11 | 5 | 37% | 281 | 651 |
| Otago | T20 | 25 | 6 | 15 | 24% | 161 | 210 |
| Otago | T20 | 19 | 12 | 6 | 63% | 120 | 169 |
| New Zealand | ODI | 10 | 10 | 0 | 100% | 255 | 360 |
| Wellington | T20 | 8 | 4 | 4 | 50% | 166 | 221 |
| Auckland Aces | First-class | 7 | 2 | 2 | 29% | 262 | 518 |
| New Zealand | Test | 7 | 3 | 0 | 43% | 298 | 609 |
| Northern Districts | First-class | 7 | 3 | 3 | 43% | 276 | 411 |
Wellington Firebirds 156/10 (37.2) · Otago Volts 112/10 (35.1) · Wellington Firebirds 300/10 (76.1) · Otago Volts 345/6 (91.0)
Northern Districts 339/10 (85.3) · Otago Volts 258/10 (77.2) · Northern Districts 271/10 (86.3) · Otago Volts 353/6 (101.1)
New Zealand 303/6 (50.0) · Zimbabwe 103/10 (27.1)
New Zealand Women 303/6 (50.0) · Zimbabwe Women 103/10 (27.1)
NZ-W won by 200 runs
Zimbabwe 102/11 (29.1) · New Zealand 106/2 (16.2)
The average first-innings score at University Oval in ODIs is 240, across 21 matches in our records. The par score (middle of the last 10 first innings) is 239.
In ODIs at University Oval, sides batting first have won 57% of decided matches (12) and chasing sides 43% (9). Evenly balanced between batting first and chasing.
The highest ODI total at University Oval is 360, and the lowest is 74.
The highest successful ODI chase at University Oval is 339. The lowest total defended is 207.
Pace bowlers have taken 73% of the wickets (with a known bowling type) in ODIs at University Oval, and spinners 27%.
Captains winning the toss in ODIs at University Oval chose to field 67% of the time, and the toss winner went on to win 57% of matches.
Ross Taylor has scored the most ODI runs at University Oval: 505 in 7 innings, averaging 84.2.
Amelia Kerr has taken the most ODI wickets at University Oval: 20 in 6 innings at an economy of 4.18.
Counted from UC Cricket's own ball-by-ball records; rebuilt nightly. Weather refreshes every few minutes.


