
Warner Park – Pitch Report, Records & Stats
Basseterre, West Indies · Capacity 10,000 · 175 matches on record
ODI Batting first has the edge at Warner Park, based on 33 decided matches.
Warner Park pitch report
T20I · 20 matches
- In 20 T20Is here, the side batting first has averaged 144; the highest total is 215.
- Chasing sides have won 83% of decided matches, so chasing is the better bet.
- The highest successful chase is 215.
- Captains winning the toss chose to field 72% of the time.
- Pace bowlers have taken 65% of the wickets here.
- Scoring is quickest in the middle overs at 8.2 an over.
ODI · 33 matches
- In 33 ODIs here, the side batting first has averaged 257; the highest total is 377.
- Chasing sides have won 42% of decided matches, so batting first is the better bet.
- The highest successful chase is 325.
- Captains winning the toss chose to field 45% of the time.
- Spinners have taken 40% of the wickets here.
- Scoring is quickest in the death overs at 7.6 an over.
T20 · 114 matches
- In 114 T20s here, the side batting first has averaged 162; the highest total is 266.
- Chasing sides have won 52% of decided matches, so neither side has the edge.
- The highest successful chase is 242.
- Captains winning the toss chose to field 73% of the time.
- Pace bowlers have taken 63% of the wickets here.
- Scoring is quickest in the death overs at 10.5 an over.
Records by format
| Format | M | Avg 1st | Avg 2nd | Bat 1st won | Chased | Highest | Lowest | Top chase | Low defended | RR | Bdry % |
|---|---|---|---|---|---|---|---|---|---|---|---|
| T20I | 20 | 144 | 123 | 3 | 15 | 215 | 16 | 215 | 182 | 7.73 | 63.7 |
| ODI | 33 | 257 | 203 | 19 | 14 | 377 | 118 | 325 | 184 | 5.27 | 52.3 |
| Test | 3 | 465 | 377 | 1 | 0 | 581 | 172 | — | 272 | 3.19 | 49.7 |
| T20 | 114 | 162 | 144 | 53 | 57 | 266 | 13 | 242 | 100 | 8.23 | 63.7 |
| First-class | 2 | 319 | 325 | 0 | 1 | 490 | 99 | 315 | — | 3.41 | — |
Par score & toss impact
T20I
- Par score
- 170
- Toss winner won
- 56%
- Chose to field
- 72%
- Bat-first won
- 17%
Last first innings: 170/10, 205/9, 214/4, 104/8, 104/8
| Phase | Run rate | Wkts |
|---|---|---|
| powerplay | 7.95 | 60 |
| middle | 8.20 | 66 |
| death | 8.00 | 47 |
Based on 20 matches.
ODI
- Par score
- 184
- Toss winner won
- 55%
- Chose to field
- 45%
- Bat-first won
- 58%
Last first innings: 136/10, 136/10, 269/7, 269/7, 341/10
| Phase | Run rate | Wkts |
|---|---|---|
| powerplay | 5.04 | 69 |
| middle | 5.04 | 210 |
| death | 7.57 | 117 |
Based on 33 matches.
Test
- Par score
- 543
- Toss winner won
- 100%
- Chose to field
- 0%
- Bat-first won
- 100%
Last first innings: 272/10, 543/6, 581/10
| Phase | Run rate | Wkts |
|---|---|---|
| first | 3.33 | 21 |
| middle | 3.04 | 26 |
| late | 3.22 | 38 |
Based on 3 matches.
T20
- Par score
- 182
- Toss winner won
- 50%
- Chose to field
- 73%
- Bat-first won
- 48%
Last first innings: 235/4, 217/4, 182/7, 174/8, 200/8
| Phase | Run rate | Wkts |
|---|---|---|
| powerplay | 7.88 | 316 |
| middle | 7.74 | 522 |
| death | 10.46 | 428 |
Based on 114 matches.
Top players at Warner Park
T20I
- Most runs
 Brandon King179
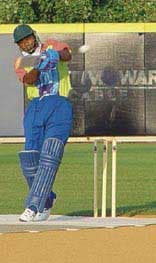 Marlon Samuels150
 Tim David132
 Shai Hope128
 Shimron Hetmyer125
- Most wickets
 Kesrick Williams9
 Jason Holder8
- Obed McCoy7
 Fahima Khatun7
 Kieron Pollard7
ODI
- Most runs
 Mahmudullah341
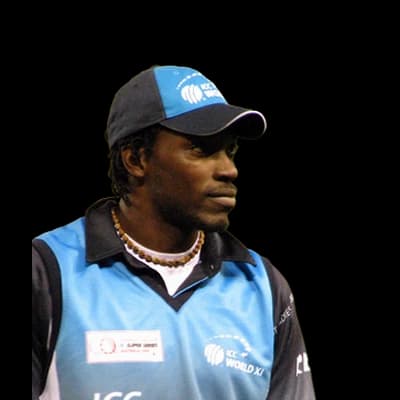 Chris Gayle248
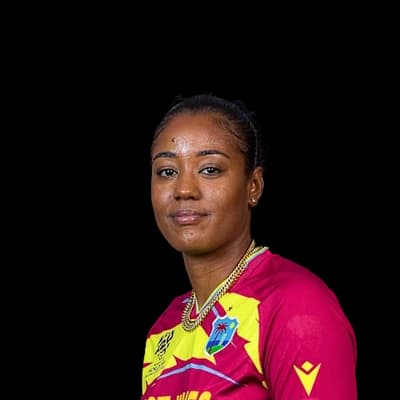 Hayley Matthews243
 Michael Clarke241
 Graeme Smith232
- Most wickets
 Sunil Narine10
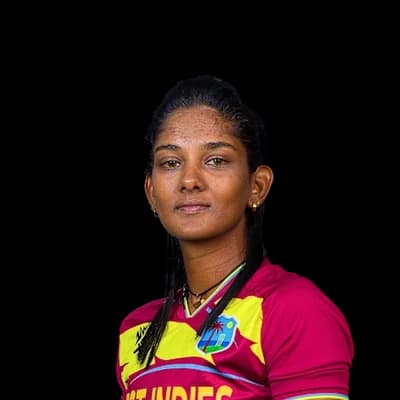 Karishma Ramharack9
 Imran Tahir9
 Afy Fletcher8
 Dwayne Bravo8
Test
- Most runs
 Shivnarine Chanderpaul274
- Daren Ganga201
- Graeme Smith178
 Jacques Kallis172
- Marlon Samuels170




T20
- Most runs
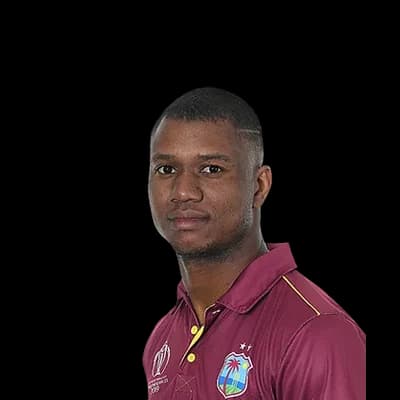 Evin Lewis1451
 Andre Fletcher1235
- Chris Gayle872
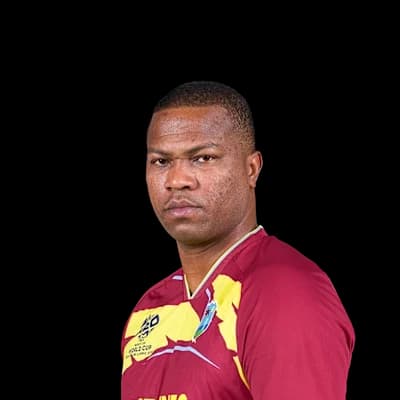 Johnson Charles681
- Kieron Pollard664
- Most wickets
- Sunil Narine28
- Imran Tahir28
- Dwayne Bravo27
- Jason Holder26
 Mohammad Amir25
Photos: ICC, Evadb, Public domain, via Wikimedia Commons, Harrias, CC BY-SA 3.0, via Wikimedia Commons, Dannow at English Wikipedia, Public domain, via Wikimedia Commons, self, CC BY-SA 2.5, via Wikimedia Commons, GraemeSmith.jpg: TonyPatterson derivative work: Bigforrap (talk), CC BY 2.0, via Wikimedia Commons, IPL, Helenabella, CC BY-SA 3.0, via Wikimedia Commons, Ukexpat, CC BY-SA 3.0, via Wikimedia Commons, Kolkata Knight Riders - Official, CC BY 3.0, via Wikimedia Commons, BeingFaridKhan, CC BY-SA 3.0, via Wikimedia Commons, Bollywood Hungama, CC BY 3.0, via Wikimedia Commons, Charaka Ranasinghe, CC BY 2.0, via Wikimedia Commons, The Madras, CC BY-SA 3.0, via Wikimedia Commons, 92 News, CC BY 3.0, via Wikimedia Commons
Weather at Warner Park
27°C
mostly clear
Feels 31°C · Humidity 81% · Wind 12.8 km/h · Cloud 42%
Rain outlook: showers possible
Dew: likely – Heavy dew is likely from about 21:00; the side bowling second may find the ball wet.
| Month | High | Low | Rain mm | Rain days |
|---|---|---|---|---|
| January | 27° | 24° | 47.6 | 15.4 |
| February | 27° | 24° | 53.4 | 14.5 |
| March | 27° | 24° | 46.2 | 15.5 |
| April | 28° | 24° | 64.2 | 16.7 |
| May | 29° | 25° | 69.6 | 18.8 |
| June | 29° | 26° | 55.8 | 17.3 |
| July | 30° | 26° | 78.8 | 20.6 |
| August | 30° | 26° | 93.9 | 20.4 |
| September | 30° | 26° | 117.9 | 20.5 |
| October | 29° | 26° | 115.8 | 20.6 |
| November | 28° | 25° | 97.4 | 17.6 |
| December | 28° | 25° | 53.9 | 16.3 |
Team records at Warner Park
| Team | Format | P | W | L | Win % | Avg | Highest |
|---|---|---|---|---|---|---|---|
| St Kitts and Nevis Patriots | T20 | 56 | 22 | 32 | 39% | 167 | 242 |
| Guyana Amazon Warriors | T20 | 28 | 18 | 9 | 64% | 155 | 266 |
| Jamaica Tallawahs | T20 | 27 | 12 | 15 | 44% | 156 | 255 |
| Trinbago Knight Riders | T20 | 21 | 13 | 6 | 62% | 158 | 250 |
| St Lucia Kings | T20 | 18 | 9 | 9 | 50% | 158 | 224 |
| Barbados Royals | T20 | 15 | 7 | 8 | 47% | 156 | 200 |
| West Indies | ODI | 14 | 8 | 6 | 57% | 254 | 338 |
| West Indies | T20I | 14 | 6 | 6 | 43% | 126 | 214 |
Recent matches at Warner Park
- Caribbean Premier League 20263 Sept 2026 · T20
St Kitts and Nevis Patriots 235/4 (20.0) · St Lucia Kings 98/10 (13.5)
- Caribbean Premier League 20261 Sept 2026 · T20
Barbados Tridents 217/4 (20.0) · St Kitts and Nevis Patriots 220/4 (19.1)
- Caribbean Premier League 202627 Aug 2026 · T20
Jamaica Kingsmen 182/7 (20.0) · St Kitts and Nevis Patriots 171/6 (20.0)
Warner Park: frequently asked questions
What is the average first-innings score at Warner Park in ODIs?
The average first-innings score at Warner Park in ODIs is 257, across 33 matches in our records. The par score (middle of the last 10 first innings) is 184.
Is it better to bat first or chase at Warner Park?
In ODIs at Warner Park, sides batting first have won 58% of decided matches (19) and chasing sides 42% (14). Batting first has the edge.
What is the highest ODI total at Warner Park?
The highest ODI total at Warner Park is 377, and the lowest is 118.
What is the highest successful chase at Warner Park in ODIs?
The highest successful ODI chase at Warner Park is 325. The lowest total defended is 184.
Does the pitch at Warner Park help pace or spin?
Pace bowlers have taken 60% of the wickets (with a known bowling type) in ODIs at Warner Park, and spinners 40%.
What do captains choose after winning the toss at Warner Park?
Captains winning the toss in ODIs at Warner Park chose to field 45% of the time, and the toss winner went on to win 55% of matches.
Who has scored the most ODI runs at Warner Park?
Mahmudullah has scored the most ODI runs at Warner Park: 341 in 6 innings, averaging 170.5.
Who has taken the most ODI wickets at Warner Park?
Sunil Narine has taken the most ODI wickets at Warner Park: 10 in 6 innings at an economy of 3.27.
More grounds in West Indies
View all →Counted from UC Cricket's own ball-by-ball records; rebuilt nightly. Weather refreshes every few minutes.