Wellington, New Zealand · 12 matches on record
T20I Evenly balanced between batting first and chasing at Sky Stadium, based on 9 decided matches.
| Format | M | Avg 1st | Avg 2nd | Bat 1st won | Chased | Highest | Lowest | Top chase | Low defended | RR | Bdry % |
|---|---|---|---|---|---|---|---|---|---|---|---|
| T20I | 9 | 162 | 155 | 4 | 5 | 216 | 96 | 216 | 128 | 8.40 | 59.4 |
| ODI | 1 | 222 | 226 | 0 | 1 | 226 | 222 | 226 | — | 5.27 | 64.3 |
Last first innings: 159/6, 164/5, 159/6, 128/9, 180/4
| Phase | Run rate | Wkts |
|---|---|---|
| powerplay | 8.29 | 18 |
| middle | 7.83 | 41 |
| death | 9.60 | 26 |
Based on 9 matches.
 Amelia Kerr115
 Devon Conway99
 Tim Seifert97
 Maddy Green91
 Mitchell Marsh82
 Jimmy Neesham5
 Sophie Devine5
 Ish Sodhi4
 Annabel Sutherland4
 Gerald Coetzee3
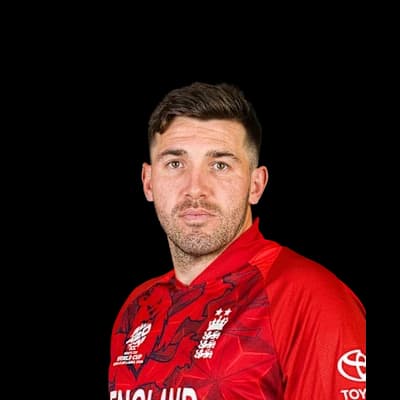 Jamie Overton68
 Rachin Ravindra46
 Daryl Mitchell44
 Jos Buttler38
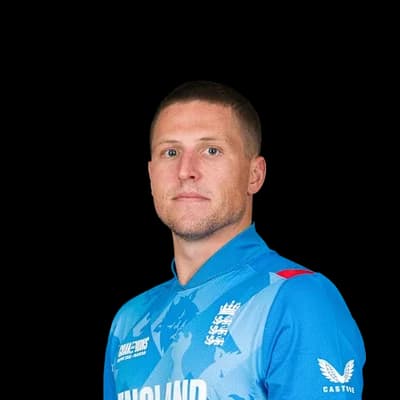 Brydon Carse36
 Blair Tickner4
 Jacob Duffy3
 Zakary Foulkes2Jamie Overton2
 Sam Curran2
Photos: ICC, IPL, Dave Morton, Public domain, via Wikimedia Commons
12°C
clear
Feels 7°C · Humidity 64% · Wind 27.2 km/h · Cloud 3%
Rain outlook: no rain expected
Dew: unlikely – No dew expected this evening.
| Team | Format | P | W | L | Win % | Avg | Highest |
|---|---|---|---|---|---|---|---|
| New Zealand | T20I | 5 | 2 | 2 | 40% | 159 | 215 |
| New Zealand | T20I | 3 | 1 | 2 | 33% | 143 | 172 |
| Australia | T20I | 2 | 1 | 1 | 50% | 179 | 216 |
| New Zealand | ODI | 2 | 1 | 0 | 50% | 226 | 226 |
| New Zealand Women | T20I | 2 | 1 | 1 | 50% | 166 | 172 |
| Australia | T20I | 1 | 1 | 0 | 100% | 180 | 180 |
| Australia Women | T20I | 1 | 1 | 0 | 100% | 180 | 180 |
| England | T20I | 1 | 1 | 0 | 100% | 128 | 128 |
South Africa 159/6 (20.0) · New Zealand 160/4 (18.3)
South Africa 164/5 (20.0) · New Zealand 145/10 (18.5)
SA won by 19 runs
South Africa Women 159/6 (20.0) · New Zealand Women 160/4 (18.3)
NZ-W won by 6 wickets
England 222/10 (40.2) · New Zealand 226/8 (44.4)
NZ won by 2 wickets
Pakistan 128/9 (20.0) · New Zealand 131/2 (10.0)
NZ won by 8 wickets
The average first-innings score at Sky Stadium in T20Is is 162, across 9 matches in our records. The par score (middle of the last 9 first innings) is 159.
In T20Is at Sky Stadium, sides batting first have won 44% of decided matches (4) and chasing sides 56% (5). Evenly balanced between batting first and chasing.
The highest T20I total at Sky Stadium is 216, and the lowest is 96.
The highest successful T20I chase at Sky Stadium is 216. The lowest total defended is 128.
Pace bowlers have taken 65% of the wickets (with a known bowling type) in T20Is at Sky Stadium, and spinners 35%.
Captains winning the toss in T20Is at Sky Stadium chose to field 44% of the time, and the toss winner went on to win 22% of matches.
Amelia Kerr has scored the most T20I runs at Sky Stadium: 115 in 3 innings, averaging 38.3.
Jimmy Neesham has taken the most T20I wickets at Sky Stadium: 5 in 2 innings at an economy of 8.88.
Counted from UC Cricket's own ball-by-ball records; rebuilt nightly. Weather refreshes every few minutes.
