Adelaide, Australia · Capacity 53,500 · Opened 1871 · 236 matches on record
ODI Chasing has the edge at Adelaide Oval, based on 33 decided matches.
| Format | M | Avg 1st | Avg 2nd | Bat 1st won | Chased | Highest | Lowest | Top chase | Low defended | RR | Bdry % |
|---|---|---|---|---|---|---|---|---|---|---|---|
| T20I | 19 | 162 | 139 | 12 | 6 | 241 | 25 | 170 | 113 | 8.00 | 55.4 |
| ODI | 34 | 236 | 222 | 14 | 19 | 369 | 105 | 299 | 203 | 5.02 | 40 |
| Test | 21 | 408 | 339 | 12 | 6 | 620 | 19 | 513 | 245 | 3.26 | 48.5 |
| T20 | 110 | 156 | 142 | 55 | 53 | 251 | 18 | 230 | 118 | 7.97 | 55 |
| List A | 12 | 240 | 222 | 4 | 8 | 330 | 128 | 330 | 190 | 5.18 | 46.1 |
| First-class | 26 | 267 | 266 | 10 | 9 | 482 | 30 | 467 | 93 | 3.09 | 46.9 |
Last first innings: 176/6, 176/6, 162/5, 162/5, 241/4
| Phase | Run rate | Wkts |
|---|---|---|
| powerplay | 7.59 | 42 |
| middle | 8.02 | 83 |
| death | 8.81 | 76 |
Based on 19 matches.
Last first innings: 264/9, 163/10, 105/10, 287/9, 298/9
| Phase | Run rate | Wkts |
|---|---|---|
| powerplay | 4.42 | 99 |
| middle | 4.85 | 248 |
| death | 6.56 | 160 |
Based on 34 matches.
Last first innings: 371/10, 180/10, 188/10, 511/7, 473/9
| Phase | Run rate | Wkts |
|---|---|---|
| first | 3.03 | 218 |
| middle | 3.25 | 225 |
| late | 3.51 | 241 |
Based on 21 matches.
Last first innings: 99/10, 232/4, 165/8, 121/10, 155/8
| Phase | Run rate | Wkts |
|---|---|---|
| powerplay | 7.75 | 294 |
| middle | 7.52 | 562 |
| death | 9.28 | 475 |
Based on 110 matches.
Last first innings: 190/10, 259/5, 273/8, 268/7, 329/9
| Phase | Run rate | Wkts |
|---|---|---|
| powerplay | 4.99 | 23 |
| middle | 5.16 | 82 |
| death | 6.64 | 42 |
Based on 12 matches.
Last first innings: 203/10, 195/10, 188/10, 228/10, 350/9
| Phase | Run rate | Wkts |
|---|---|---|
| first | 2.71 | 280 |
| middle | 3.22 | 359 |
| late | 3.48 | 245 |
Based on 26 matches.
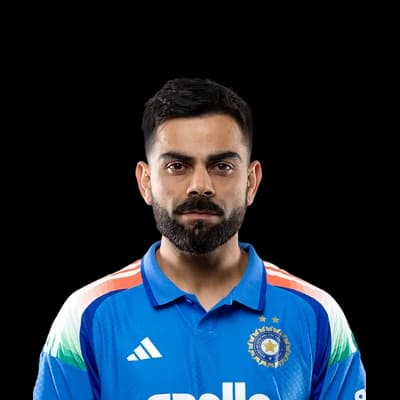 Virat Kohli204
 Aaron Finch190
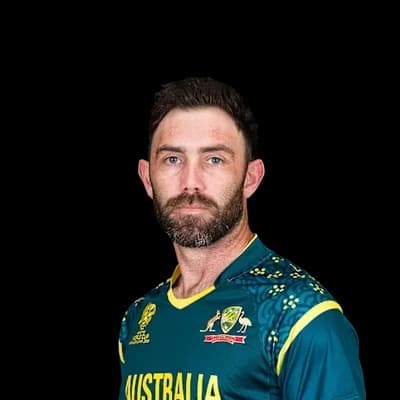 Glenn Maxwell182
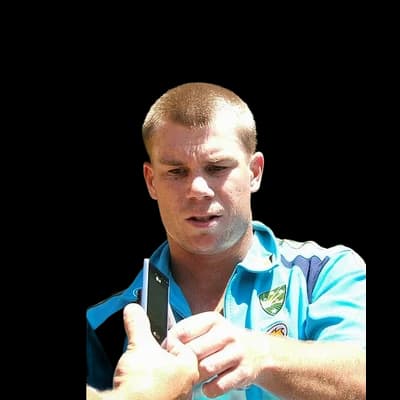 David Warner169
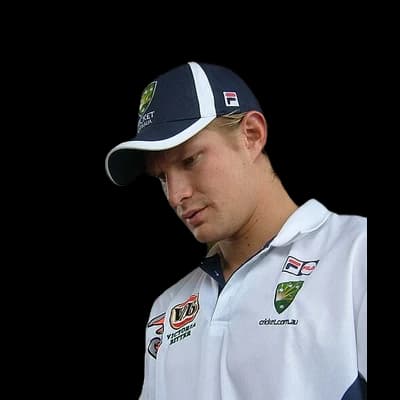 Shane Watson118
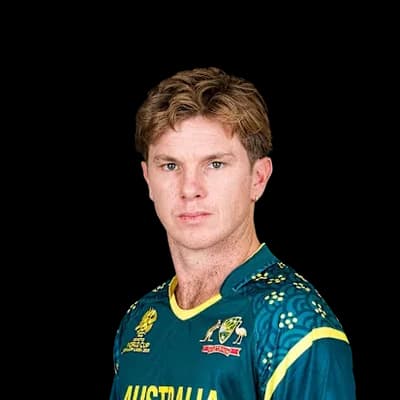 Adam Zampa7Shane Watson6
 Brandon Glover5
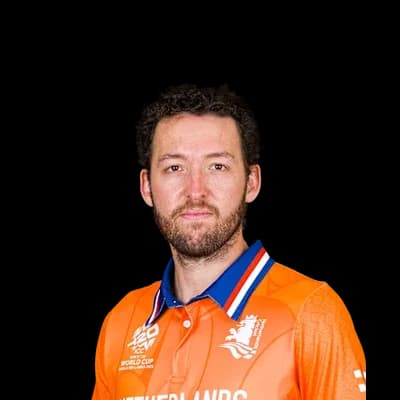 Paul van Meekeren4
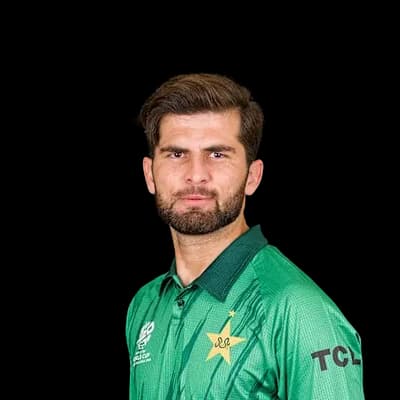 Shaheen Afridi4
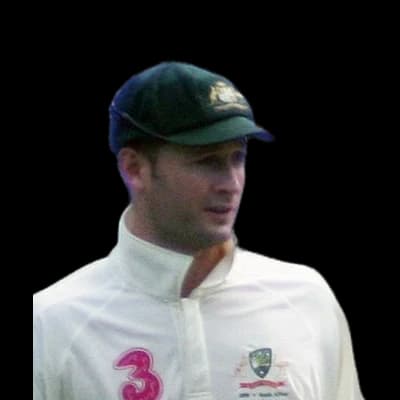 Michael Clarke590David Warner469
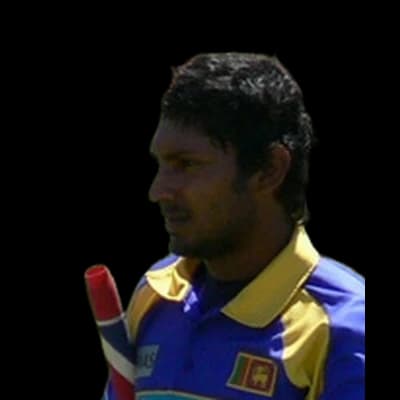 Kumar Sangakkara416
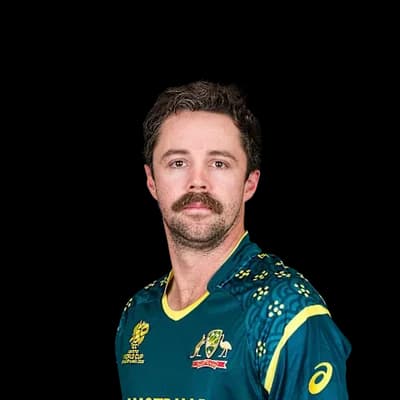 Travis Head329
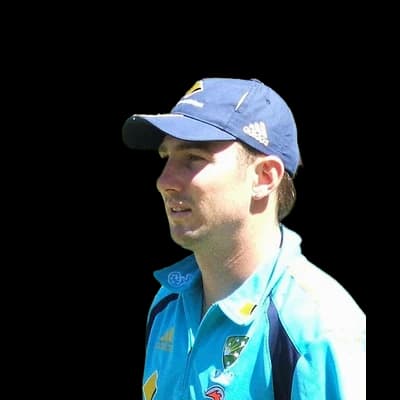 Shaun Marsh313
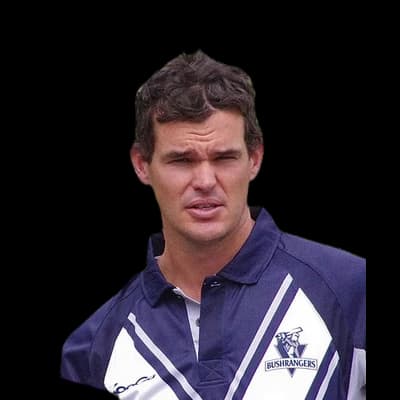 Clint McKay17
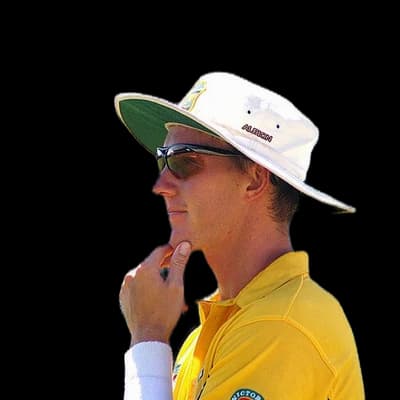 Brett Lee13
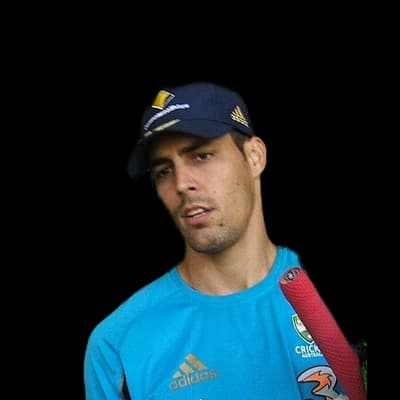 Mitchell Johnson12
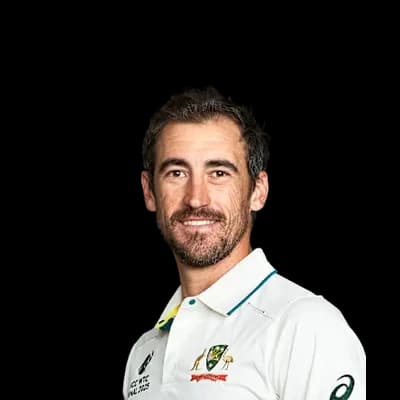 Mitchell Starc11
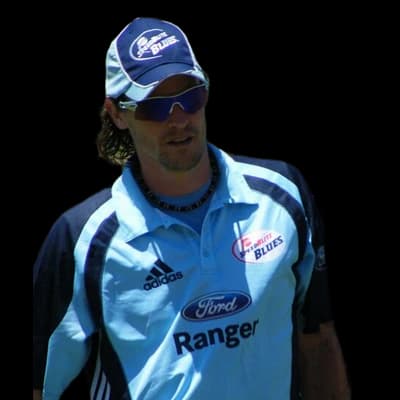 Nathan Bracken11Michael Clarke1414David Warner1202
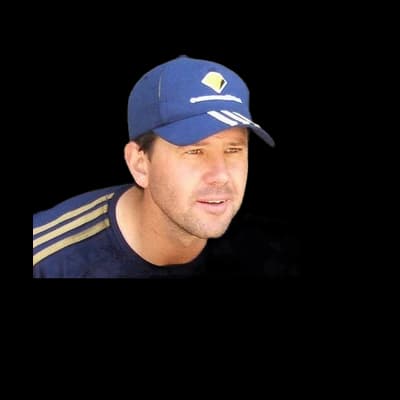 Ricky Ponting870Travis Head814
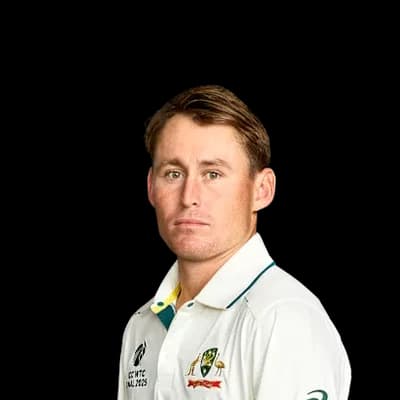 Marnus Labuschagne670
 Nathan Lyon68Mitchell Starc59
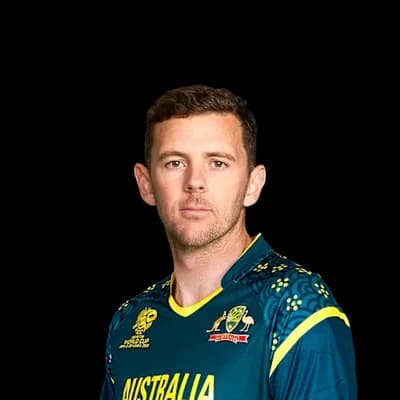 Josh Hazlewood41
 Pat Cummins32Mitchell Johnson31
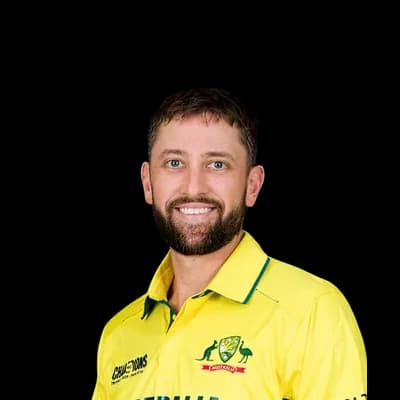 Matthew Short1378
 Jake Weatherald1133
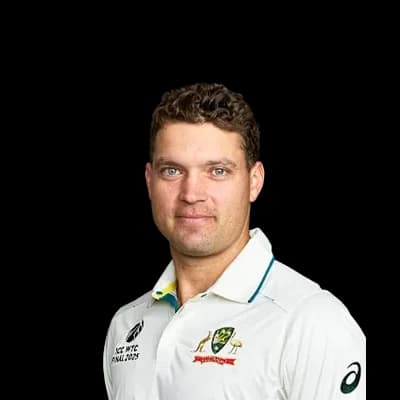 Alex Carey1052Jonathan Wells1025
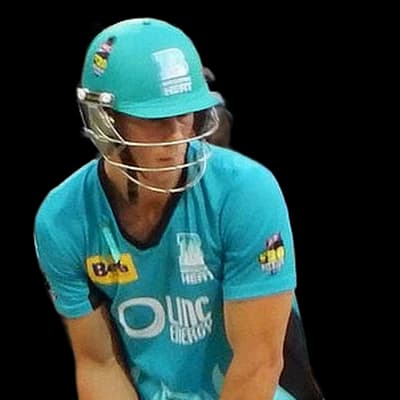 Chris Lynn794
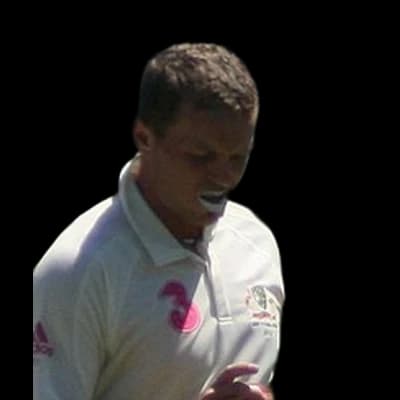 Peter Siddle57
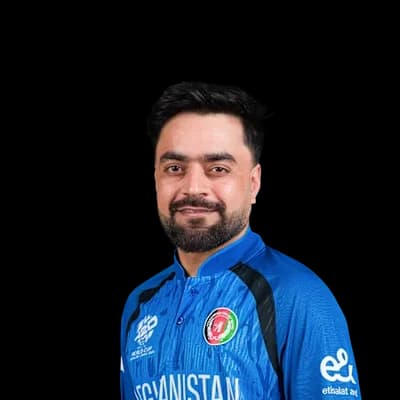 Rashid Khan48Wes Agar40Ben Laughlin33
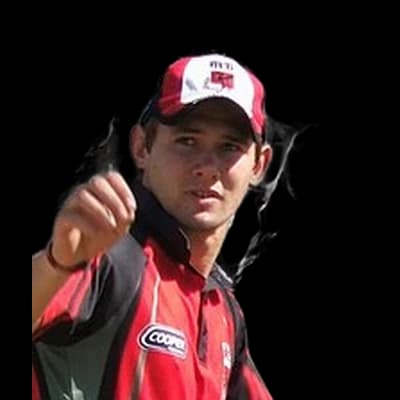 Kane Richardson31
Photos: BCCI, Supun47, CC BY-SA 3.0, via Wikimedia Commons, ICC, YellowMonkey/Blnguyen, CC BY-SA 4.0, via Wikimedia Commons, paddynapper, CC BY-SA 2.0, via Wikimedia Commons, self, CC BY-SA 2.5, via Wikimedia Commons, Sangakkara.jpg: TonyPatterson derivative work: Chamal N (talk), CC BY 2.0, via Wikimedia Commons, Naparazzi, CC BY-SA 2.0, via Wikimedia Commons, CC BY-SA 2.5, via Wikimedia Commons, Haley Jackson, CC BY 2.0, via Wikimedia Commons, PrivateMusings, CC BY-SA 2.5, via Wikimedia Commons, YellowMonkey, CC BY-SA 3.0, via Wikimedia Commons
10°C
clear
Feels 9°C · Humidity 85% · Wind 3.4 km/h · Cloud 0%
Rain outlook: no rain expected
Dew: likely – Heavy dew is likely from about 01:00; the side bowling second may find the ball wet.
| Month | High | Low | Rain mm | Rain days |
|---|---|---|---|---|
| January | 29° | 17° | 29.9 | 4.3 |
| February | 27° | 17° | 24.1 | 2.7 |
| March | 26° | 16° | 20.9 | 4.1 |
| April | 22° | 14° | 45.2 | 7 |
| May | 18° | 11° | 72.1 | 11.1 |
| June | 15° | 9° | 100.7 | 13.1 |
| July | 14° | 9° | 92 | 13.3 |
| August | 15° | 9° | 94.3 | 13.9 |
| September | 17° | 10° | 58.1 | 11.4 |
| October | 20° | 11° | 54.3 | 8.9 |
| November | 23° | 13° | 50 | 8.2 |
| December | 26° | 15° | 26.9 | 4.6 |
| Team | Format | P | W | L | Win % | Avg | Highest |
|---|---|---|---|---|---|---|---|
| Adelaide Strikers | T20 | 86 | 45 | 35 | 52% | 160 | 251 |
| South Australia | First-class | 30 | 6 | 13 | 20% | 248 | 482 |
| Australia | ODI | 26 | 17 | 8 | 65% | 234 | 369 |
| Australia | Test | 21 | 16 | 2 | 76% | 320 | 604 |
| Adelaide Strikers | T20 | 19 | 9 | 9 | 47% | 119 | 175 |
| Perth Scorchers | T20 | 14 | 6 | 7 | 43% | 153 | 232 |
| Sydney Thunder | T20 | 14 | 6 | 6 | 43% | 151 | 232 |
| Hobart Hurricanes | T20 | 13 | 4 | 8 | 31% | 173 | 229 |
South Australia 203/10 (68.1) · Queensland 238/10 (77.4) · South Australia 145/10 (47.3) · Queensland 114/4 (36.4)
QB won by 6 wickets
The average first-innings score at Adelaide Oval in ODIs is 236, across 34 matches in our records. The par score (middle of the last 10 first innings) is 237.
In ODIs at Adelaide Oval, sides batting first have won 42% of decided matches (14) and chasing sides 58% (19). Chasing has the edge.
The highest ODI total at Adelaide Oval is 369, and the lowest is 105.
The highest successful ODI chase at Adelaide Oval is 299. The lowest total defended is 203.
Pace bowlers have taken 78% of the wickets (with a known bowling type) in ODIs at Adelaide Oval, and spinners 22%.
Captains winning the toss in ODIs at Adelaide Oval chose to field 26% of the time, and the toss winner went on to win 52% of matches.
Michael Clarke has scored the most ODI runs at Adelaide Oval: 590 in 14 innings, averaging 53.6.
Clint McKay has taken the most ODI wickets at Adelaide Oval: 17 in 7 innings at an economy of 4.41.
Counted from UC Cricket's own ball-by-ball records; rebuilt nightly. Weather refreshes every few minutes.


