Sydney, Australia · Capacity 20,000 · Opened 1867 · 103 matches on record
T20I Chasing has the edge at North Sydney Oval, based on 9 decided matches.
| Format | M | Avg 1st | Avg 2nd | Bat 1st won | Chased | Highest | Lowest | Top chase | Low defended | RR | Bdry % |
|---|---|---|---|---|---|---|---|---|---|---|---|
| T20I | 10 | 157 | 141 | 2 | 7 | 226 | 84 | 213 | 217 | 8.14 | 62.9 |
| ODI | 8 | 247 | 206 | 4 | 4 | 336 | 127 | 289 | 229 | 5.19 | 55.9 |
| Test | 1 | 280 | 448 | 0 | 0 | 448 | 206 | — | — | 2.41 | 51.3 |
| T20 | 67 | 156 | 137 | 39 | 26 | 242 | 13 | 184 | 116 | 7.86 | 61 |
| List A | 8 | 269 | 231 | 4 | 3 | 330 | 165 | 256 | 291 | 6.00 | 61.2 |
Last first innings: 162/2, 212/6, 147/3, 118/10, 226/2
| Phase | Run rate | Wkts |
|---|---|---|
| powerplay | 6.90 | 30 |
| middle | 8.51 | 35 |
| death | 9.27 | 35 |
Based on 10 matches.
Last first innings: 204/10, 204/10, 277/9, 229/6, 336/9
| Phase | Run rate | Wkts |
|---|---|---|
| powerplay | 4.61 | 17 |
| middle | 5.09 | 61 |
| death | 6.81 | 29 |
Based on 8 matches.
Last first innings: 183/8, 173/4, 149/9, 174/6, 155/10
| Phase | Run rate | Wkts |
|---|---|---|
| powerplay | 7.15 | 180 |
| middle | 7.80 | 302 |
| death | 9.19 | 295 |
Based on 67 matches.
Last first innings: 183/8, 311/10, 217/10, 291/10, 298/5
| Phase | Run rate | Wkts |
|---|---|---|
| powerplay | 4.99 | 21 |
| middle | 5.90 | 65 |
| death | 8.42 | 25 |
Based on 8 matches.
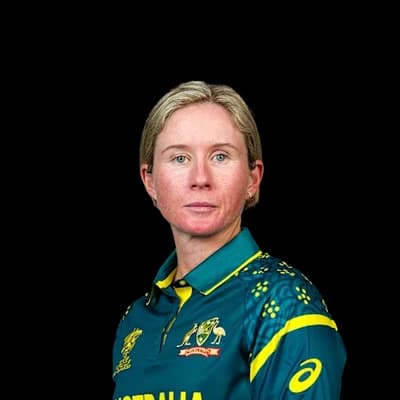 Beth Mooney325
 Alyssa Healy298
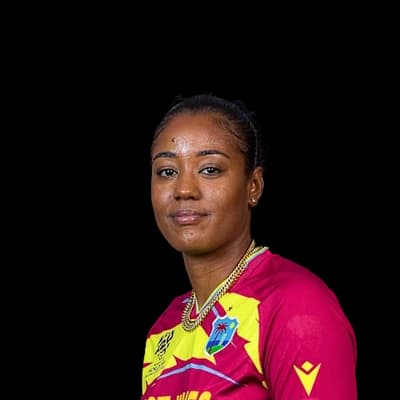 Hayley Matthews231
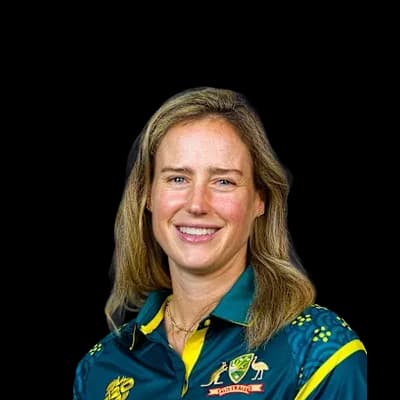 Ellyse Perry188
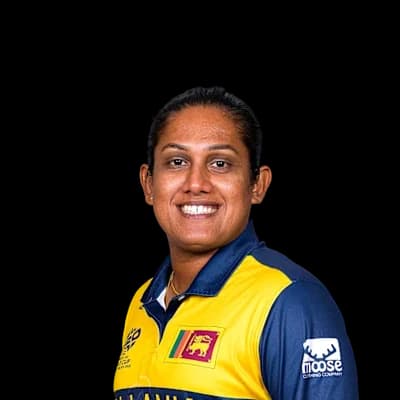 Chamari Athapaththu159
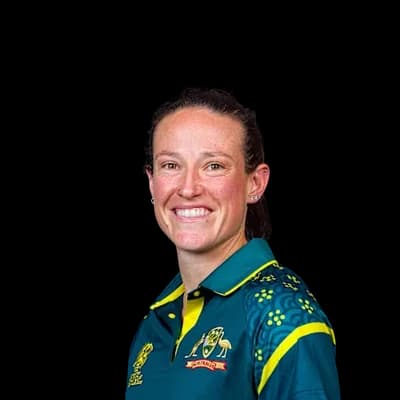 Megan Schutt15Ellyse Perry7Hayley Matthews7
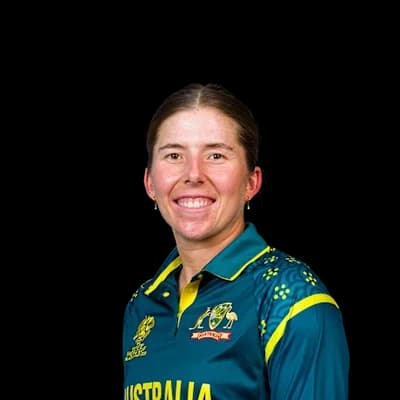 Georgia Wareham5
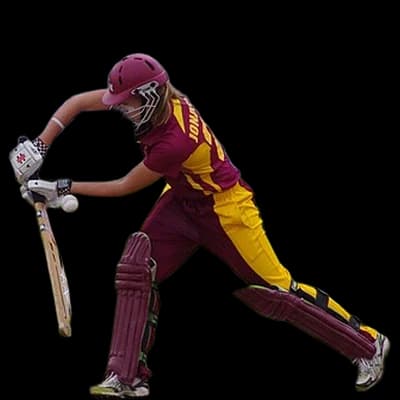 Jess Jonassen4Beth Mooney243
 Meg Lanning182
 Amy Satterthwaite147Alyssa Healy138
 Suzie Bates113
 Ashleigh Gardner8
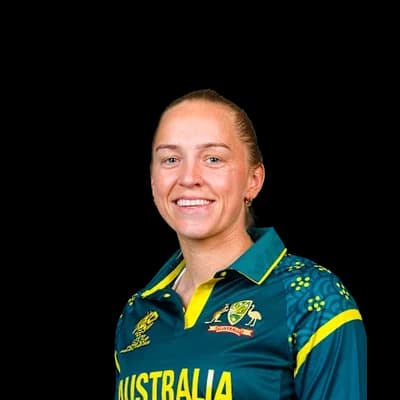 Kim Garth6
 Alana King6Megan Schutt4
 Marizanne Kapp4Ellyse Perry213
 Heather Knight141
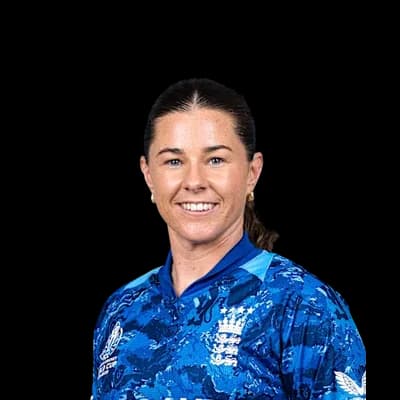 Tammy Beaumont107
 Georgia Elwiss68
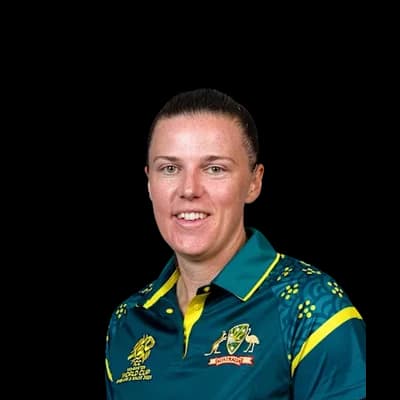 Tahlia McGrath47
 Laura Marsh3Ellyse Perry3Tahlia McGrath3
 Sophie Ecclestone3Jess Jonassen2Ellyse Perry1234Ashleigh Gardner753Alyssa Healy612Beth Mooney580
 Grace Harris504Ashleigh Gardner35
 Lauren Cheatle26
 Sammy Jo Johnson21Hannah Darlington20Jess Jonassen19
Photos: ICC, Naparazzi, CC BY-SA 2.0, via Wikimedia Commons, Yu Chu Chin, CC BY-SA 4.0, via Wikimedia Commons, New Zealand Government, Office of the Governor-General, CC0, via Wikimedia Commons, Bahnfrend, CC BY-SA 4.0, via Wikimedia Commons, Harrias, CC BY-SA 4.0, via Wikimedia Commons
14°C
mostly clear
Feels 12°C · Humidity 65% · Wind 9.5 km/h · Cloud 23%
Rain outlook: no rain expected
Dew: likely – Heavy dew is likely from about 23:00; the side bowling second may find the ball wet.
| Month | High | Low | Rain mm | Rain days |
|---|---|---|---|---|
| January | 27° | 19° | 111 | 13.1 |
| February | 26° | 19° | 106 | 13.5 |
| March | 25° | 18° | 156.3 | 15.9 |
| April | 23° | 15° | 72 | 9.5 |
| May | 20° | 12° | 82.9 | 9.7 |
| June | 17° | 9° | 71.5 | 9.7 |
| July | 17° | 8° | 71.8 | 7.5 |
| August | 18° | 9° | 67.7 | 7.7 |
| September | 21° | 11° | 49.4 | 6.7 |
| October | 23° | 13° | 73.4 | 11.1 |
| November | 24° | 15° | 80.7 | 10.8 |
| December | 26° | 18° | 65.2 | 10.3 |
| Team | Format | P | W | L | Win % | Avg | Highest |
|---|---|---|---|---|---|---|---|
| Sydney Sixers | T20 | 33 | 17 | 16 | 52% | 146 | 242 |
| Sydney Thunder | T20 | 18 | 10 | 7 | 56% | 149 | 212 |
| Brisbane Heat | T20 | 15 | 7 | 8 | 47% | 155 | 229 |
| Adelaide Strikers | T20 | 13 | 9 | 4 | 69% | 142 | 172 |
| Melbourne Stars | T20 | 12 | 7 | 4 | 58% | 157 | 219 |
| Perth Scorchers | T20 | 12 | 5 | 7 | 42% | 152 | 189 |
| Hobart Hurricanes | T20 | 10 | 2 | 8 | 20% | 131 | 156 |
| Australia | T20I | 9 | 8 | 1 | 89% | 158 | 226 |
New Zealand Women 162/2 (20.0) · Australia Women 161/8 (18.1)
The average first-innings score at North Sydney Oval in T20Is is 157, across 10 matches in our records. The par score (middle of the last 10 first innings) is 162.
In T20Is at North Sydney Oval, sides batting first have won 22% of decided matches (2) and chasing sides 78% (7). Chasing has the edge.
The highest T20I total at North Sydney Oval is 226, and the lowest is 84.
The highest successful T20I chase at North Sydney Oval is 213. The lowest total defended is 217.
Pace bowlers have taken 60% of the wickets (with a known bowling type) in T20Is at North Sydney Oval, and spinners 40%.
Captains winning the toss in T20Is at North Sydney Oval chose to field 56% of the time, and the toss winner went on to win 78% of matches.
Beth Mooney has scored the most T20I runs at North Sydney Oval: 325 in 8 innings, averaging 54.2.
Megan Schutt has taken the most T20I wickets at North Sydney Oval: 15 in 8 innings at an economy of 5.97.
Counted from UC Cricket's own ball-by-ball records; rebuilt nightly. Weather refreshes every few minutes.
