Hobart, Australia · Capacity 16,200 · Opened 1914 · 240 matches on record
ODI Batting first has the edge at Bellerive Oval, based on 26 decided matches.
| Format | M | Avg 1st | Avg 2nd | Bat 1st won | Chased | Highest | Lowest | Top chase | Low defended | RR | Bdry % |
|---|---|---|---|---|---|---|---|---|---|---|---|
| T20I | 17 | 154 | 143 | 7 | 9 | 213 | 51 | 188 | 144 | 8.18 | 56.1 |
| ODI | 26 | 279 | 231 | 15 | 11 | 409 | 130 | 321 | 230 | 5.54 | 44.6 |
| Test | 8 | 348 | 270 | 7 | 1 | 583 | 78 | 406 | 85 | 3.34 | 49.7 |
| T20 | 116 | 157 | 143 | 55 | 56 | 229 | 60 | 209 | 114 | 7.95 | 54.4 |
| List A | 20 | 275 | 237 | 8 | 11 | 376 | 118 | 298 | 287 | 5.84 | 47.2 |
| First-class | 32 | 281 | 243 | 17 | 8 | 537 | 32 | 390 | 104 | 3.27 | 53 |
Last first innings: 186/6, 117/10, 213/7, 162/7, 96/7
| Phase | Run rate | Wkts |
|---|---|---|
| powerplay | 8.07 | 55 |
| middle | 7.72 | 90 |
| death | 9.34 | 64 |
Based on 17 matches.
Last first innings: 409/7, 409/7, 251/9, 251/9, 308/8
| Phase | Run rate | Wkts |
|---|---|---|
| powerplay | 4.77 | 57 |
| middle | 5.19 | 166 |
| death | 7.52 | 112 |
Based on 26 matches.
Last first innings: 303/10, 85/10, 583/4, 450/5, 150/10
| Phase | Run rate | Wkts |
|---|---|---|
| first | 3.12 | 95 |
| middle | 3.42 | 96 |
| late | 3.57 | 67 |
Based on 8 matches.
Last first innings: 114/5, 160/8, 178/6, 229/3, 162/9
| Phase | Run rate | Wkts |
|---|---|---|
| powerplay | 7.47 | 355 |
| middle | 7.87 | 553 |
| death | 8.85 | 525 |
Based on 116 matches.
Last first innings: 304/7, 118/10, 274/10, 295/9, 238/9
| Phase | Run rate | Wkts |
|---|---|---|
| powerplay | 6.14 | 40 |
| middle | 5.70 | 111 |
| death | 7.42 | 60 |
Based on 20 matches.
Last first innings: 241/10, 198/10, 222/10, 136/10, 209/10
| Phase | Run rate | Wkts |
|---|---|---|
| first | 3.06 | 366 |
| middle | 3.20 | 441 |
| late | 3.80 | 262 |
Based on 32 matches.
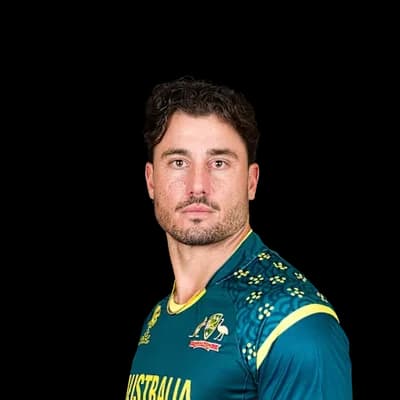 Marcus Stoinis140
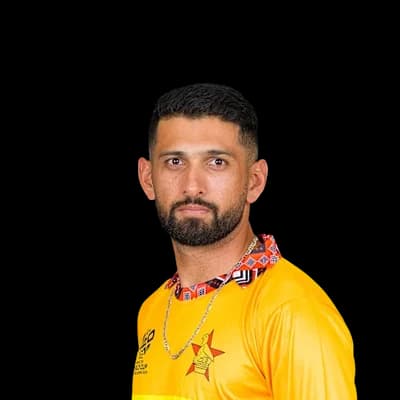 Sikandar Raza136
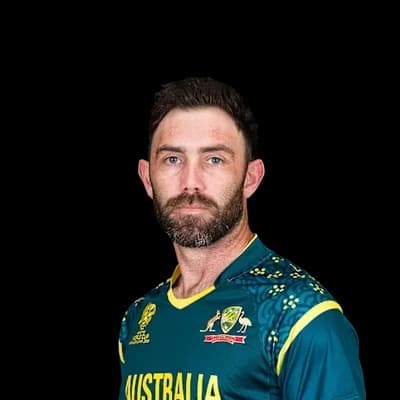 Glenn Maxwell133
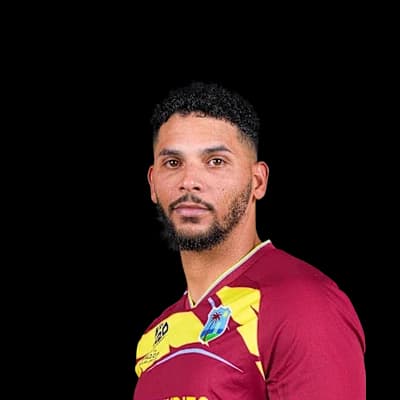 Brandon King132
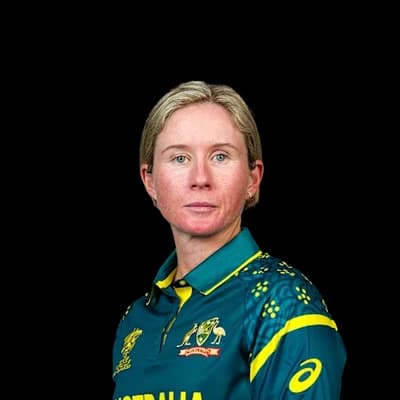 Beth Mooney128
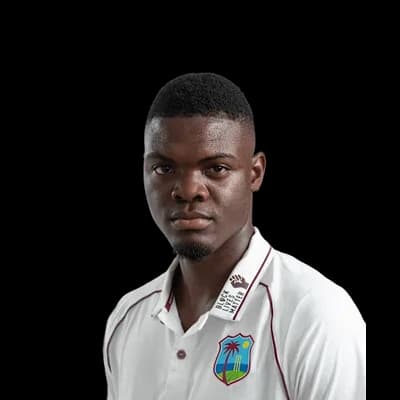 Alzarri Joseph8
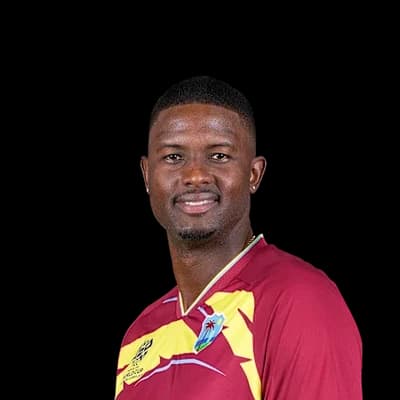 Jason Holder6
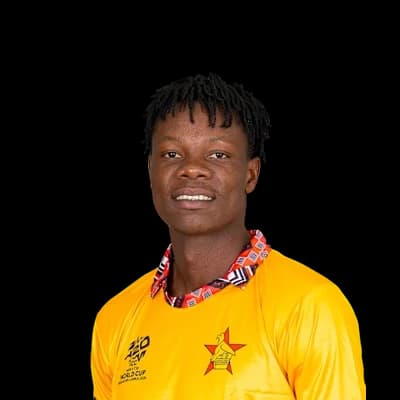 Blessing Muzarabani6
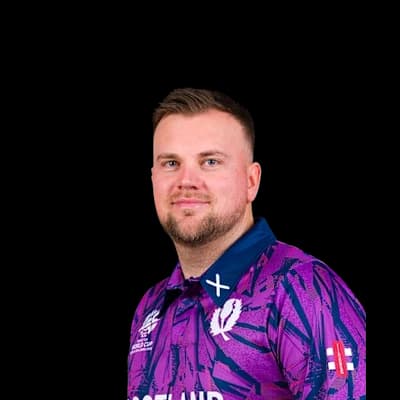 Mark Watt5
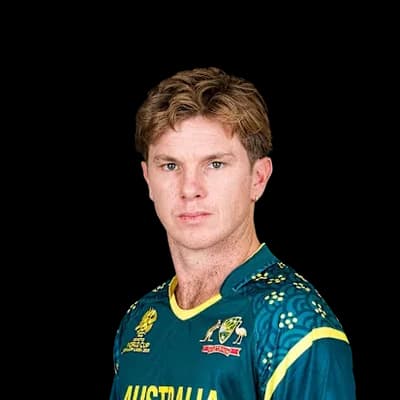 Adam Zampa5
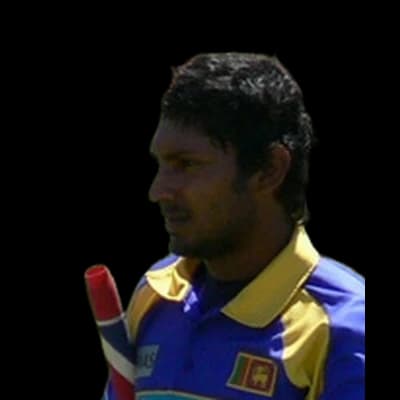 Kumar Sangakkara346
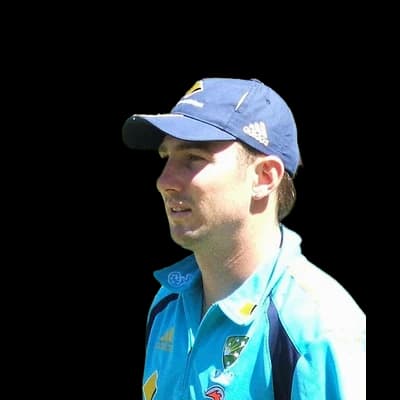 Shaun Marsh339
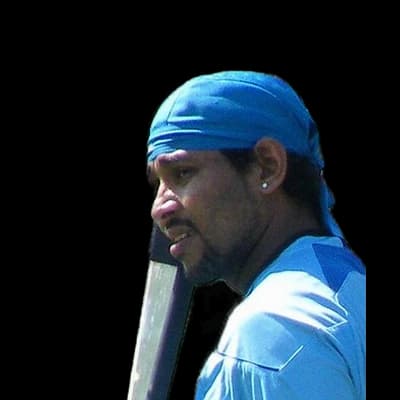 Tillakaratne Dilshan324
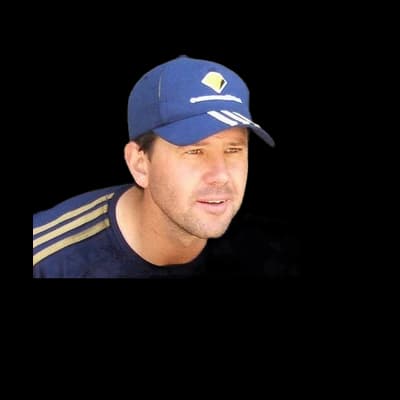 Ricky Ponting260
 Adam Gilchrist235
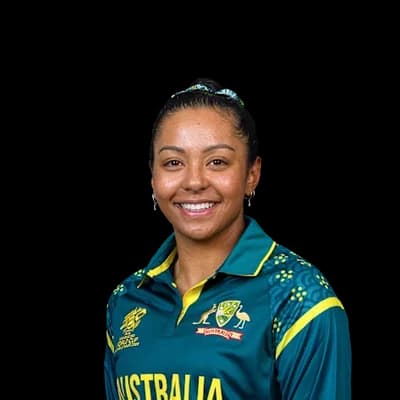 Alana King11
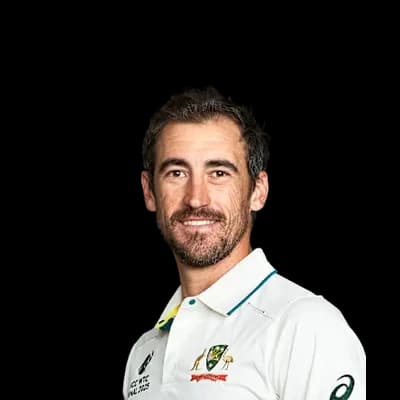 Mitchell Starc7
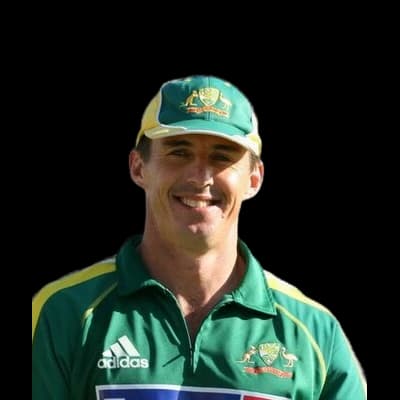 Brad Hogg7
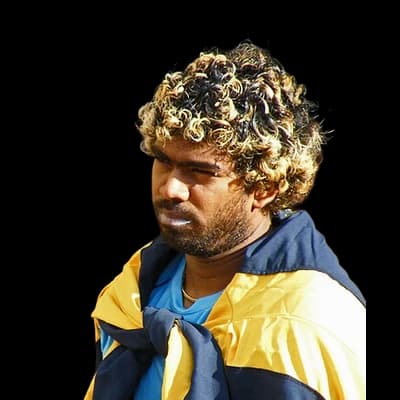 Lasith Malinga6
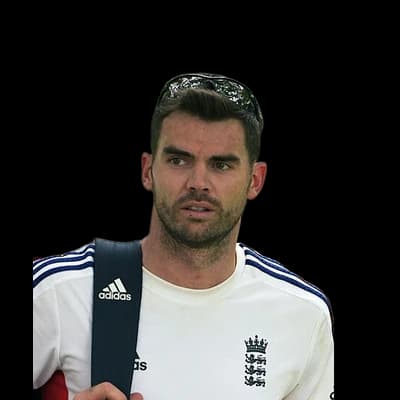 James Anderson6
 Michael Hussey507Ricky Ponting420
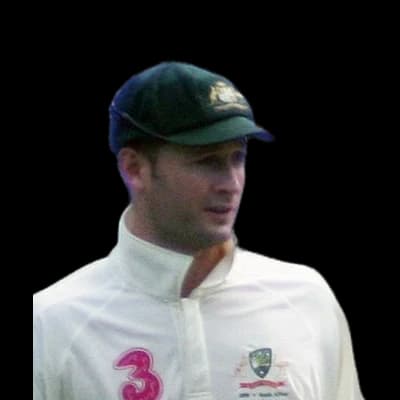 Michael Clarke395
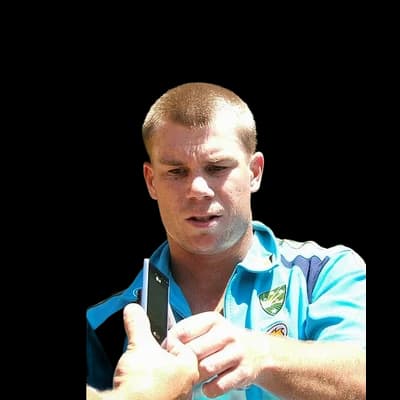 David Warner373Kumar Sangakkara316
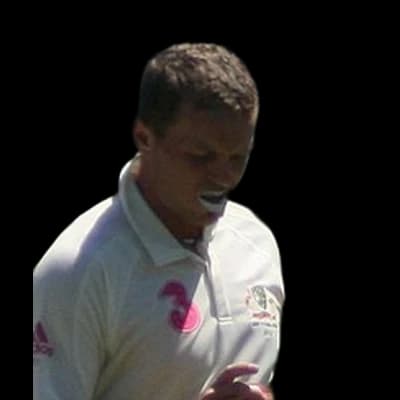 Peter Siddle22Mitchell Starc15
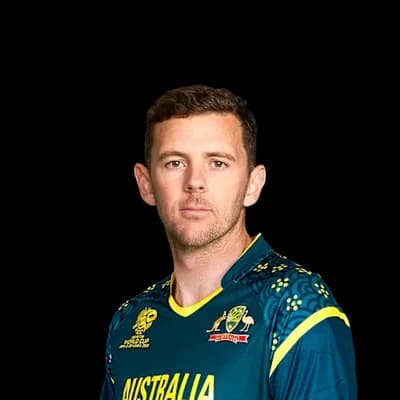 Josh Hazlewood13
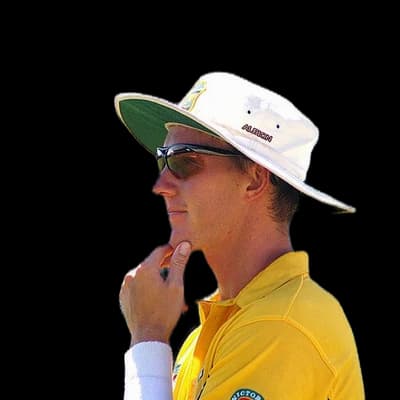 Brett Lee13
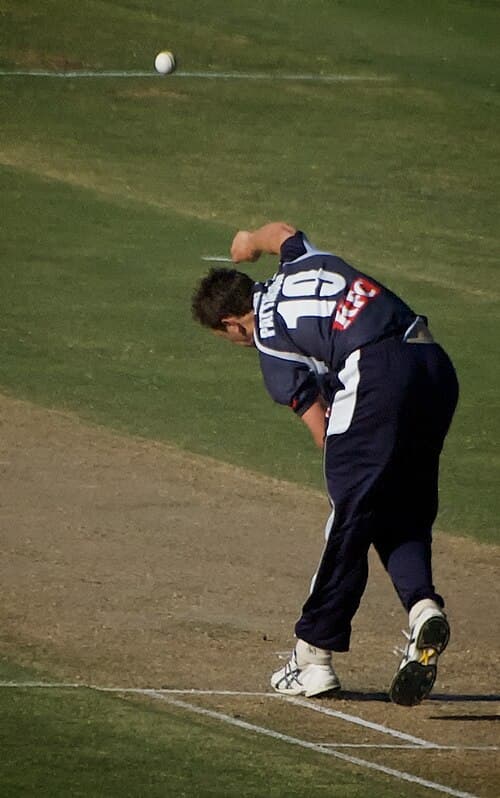 James Pattinson13
 Ben McDermott1222
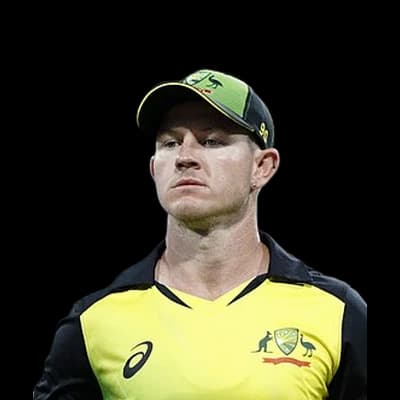 D'Arcy Short1040
 Matthew Wade884
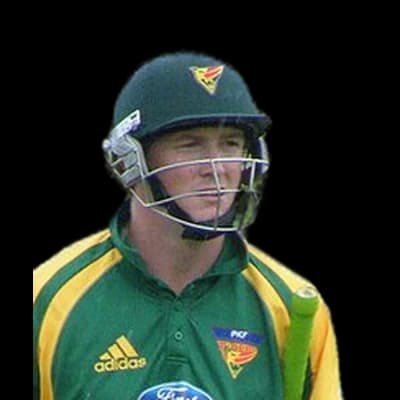 George Bailey668
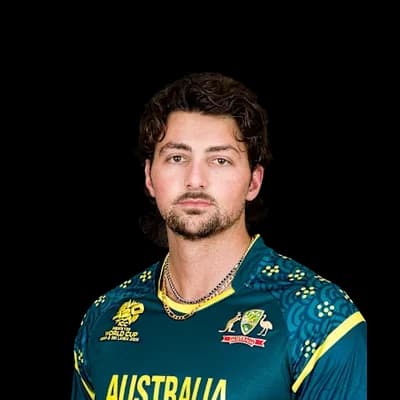 Tim David550Riley Meredith56
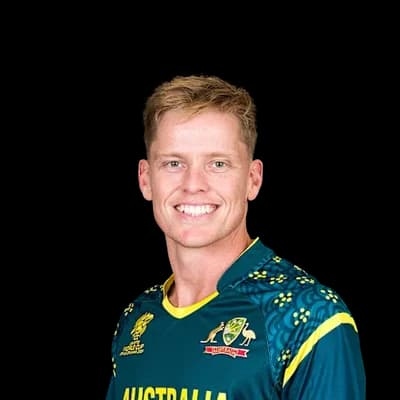 Nathan Ellis51Cameron Boyce30
 Molly Strano24
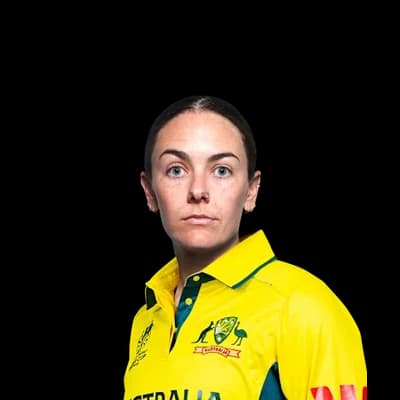 Heather Graham23
Photos: ICC, Sangakkara.jpg: TonyPatterson derivative work: Chamal N (talk), CC BY 2.0, via Wikimedia Commons, YellowMonkey/Blnguyen, CC BY-SA 4.0, via Wikimedia Commons, TM_Dlshan_and_Kumar_Sangakkara.jpg: paddynapper derivative work: ≈ Chamal talk ¤, CC BY-SA 2.0, via Wikimedia Commons, Luton Anderson, CC BY-SA 2.0, via Wikimedia Commons, BradleyHogg.jpg: Deon Maritz from Cape Town, South Africa derivative work: Ignor, CC BY 2.0, via Wikimedia Commons, paddynapper, CC BY-SA 2.0, via Wikimedia Commons, NAPARAZZI, CC BY-SA 2.0, via Wikimedia Commons, self, CC BY-SA 2.5, via Wikimedia Commons, PrivateMusings, CC BY-SA 2.5, via Wikimedia Commons, CC BY-SA 2.5, via Wikimedia Commons, Helenabella, CC BY-SA 3.0, via Wikimedia Commons, www.davidmolloyphotography.com from Sydney, Australia, CC BY 2.0, via Wikimedia Commons, Bahnfrend, CC BY-SA 4.0, via Wikimedia Commons
11°C
overcast
Feels 7°C · Humidity 57% · Wind 15.9 km/h · Cloud 95%
Rain outlook: no rain expected
Dew: possible – Dew is possible from about 00:00; the side bowling second may find the ball wet.
| Month | High | Low | Rain mm | Rain days |
|---|---|---|---|---|
| January | 23° | 13° | 50.1 | 8 |
| February | 22° | 12° | 37.9 | 7.8 |
| March | 21° | 11° | 51.9 | 7.5 |
| April | 18° | 9° | 39 | 7.7 |
| May | 15° | 7° | 57 | 8.3 |
| June | 13° | 5° | 59.6 | 8.5 |
| July | 12° | 5° | 44.6 | 9.3 |
| August | 13° | 5° | 53.3 | 10 |
| September | 15° | 6° | 50.7 | 9.9 |
| October | 17° | 8° | 83.6 | 11.5 |
| November | 19° | 9° | 75.4 | 12.7 |
| December | 21° | 11° | 69.9 | 10.9 |
| Team | Format | P | W | L | Win % | Avg | Highest |
|---|---|---|---|---|---|---|---|
| Hobart Hurricanes | T20 | 72 | 42 | 25 | 58% | 161 | 209 |
| Tasmania | First-class | 36 | 12 | 13 | 33% | 270 | 537 |
| Hobart Hurricanes | T20 | 33 | 15 | 17 | 45% | 140 | 212 |
| Tasmania | List A | 16 | 5 | 8 | 31% | 249 | 376 |
| Melbourne Renegades | T20 | 14 | 5 | 9 | 36% | 149 | 183 |
| Sydney Thunder | T20 | 13 | 2 | 10 | 15% | 156 | 197 |
| Australia | ODI | 12 | 9 | 2 | 75% | 265 | 344 |
| Sydney Sixers | T20 | 12 | 5 | 6 | 42% | 160 | 205 |
Victoria 304/7 (50.0) · Tasmania 137/10 (25.2)
VIC won by 138 runs (DLS method)
Tasmania 241/10 (89.2) · Victoria 207/10 (61.1) · Tasmania 236/10 (85.3) · Victoria 266/10 (85.0)
TT won by 4 runs
The average first-innings score at Bellerive Oval in ODIs is 279, across 26 matches in our records. The par score (middle of the last 10 first innings) is 308.
In ODIs at Bellerive Oval, sides batting first have won 58% of decided matches (15) and chasing sides 42% (11). Batting first has the edge.
The highest ODI total at Bellerive Oval is 409, and the lowest is 130.
The highest successful ODI chase at Bellerive Oval is 321. The lowest total defended is 230.
Pace bowlers have taken 70% of the wickets (with a known bowling type) in ODIs at Bellerive Oval, and spinners 30%.
Captains winning the toss in ODIs at Bellerive Oval chose to field 46% of the time, and the toss winner went on to win 42% of matches.
Kumar Sangakkara has scored the most ODI runs at Bellerive Oval: 346 in 5 innings, averaging 69.2.
Alana King has taken the most ODI wickets at Bellerive Oval: 11 in 3 innings at an economy of 4.24.
Counted from UC Cricket's own ball-by-ball records; rebuilt nightly. Weather refreshes every few minutes.


