Brisbane, Australia · 101 matches on record
ODI Chasing has the edge at Allan Border Field, based on 14 decided matches.
| Format | M | Avg 1st | Avg 2nd | Bat 1st won | Chased | Highest | Lowest | Top chase | Low defended | RR | Bdry % |
|---|---|---|---|---|---|---|---|---|---|---|---|
| T20I | 6 | 145 | 136 | 2 | 4 | 190 | 121 | 149 | 138 | 7.22 | 56.6 |
| ODI | 17 | 210 | 175 | 4 | 10 | 371 | 83 | 255 | 281 | 4.88 | 49.6 |
| T20 | 33 | 142 | 131 | 15 | 18 | 200 | 46 | 185 | 113 | 7.44 | 54.8 |
| List A | 19 | 261 | 237 | 6 | 11 | 381 | 104 | 323 | 278 | 5.75 | 56.7 |
| First-class | 12 | 253 | 349 | 4 | 4 | 612 | 44 | 516 | 63 | 3.28 | 56.9 |
Last first innings: 146/6, 190/9, 123/7, 128/10, 138/6
| Phase | Run rate | Wkts |
|---|---|---|
| powerplay | 7.10 | 15 |
| middle | 7.13 | 31 |
| death | 7.58 | 33 |
Based on 6 matches.
Last first innings: 172/10, 220/6, 166/10, 214/10, 214/10
| Phase | Run rate | Wkts |
|---|---|---|
| powerplay | 4.68 | 43 |
| middle | 4.73 | 107 |
| death | 6.01 | 64 |
Based on 17 matches.
Last first innings: 171/8, 200/6, 172/3, 133/10, 181/8
| Phase | Run rate | Wkts |
|---|---|---|
| powerplay | 6.87 | 95 |
| middle | 7.23 | 161 |
| death | 8.78 | 150 |
Based on 33 matches.
Last first innings: 358/10, 335/7, 104/10, 288/6, 194/10
| Phase | Run rate | Wkts |
|---|---|---|
| powerplay | 5.00 | 44 |
| middle | 5.82 | 107 |
| death | 8.47 | 65 |
Based on 19 matches.
Last first innings: 210/10, 379/10, 299/10, 461/10, 314/10
| Phase | Run rate | Wkts |
|---|---|---|
| first | 3.11 | 109 |
| middle | 3.20 | 116 |
| late | 3.58 | 90 |
Based on 12 matches.
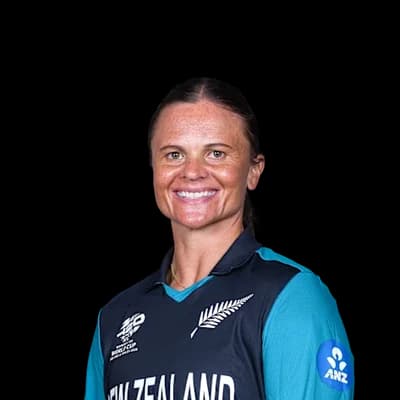 Suzie Bates154
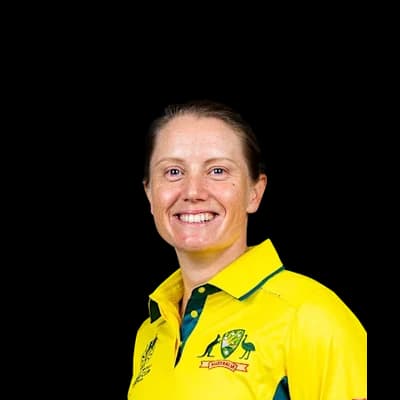 Alyssa Healy149
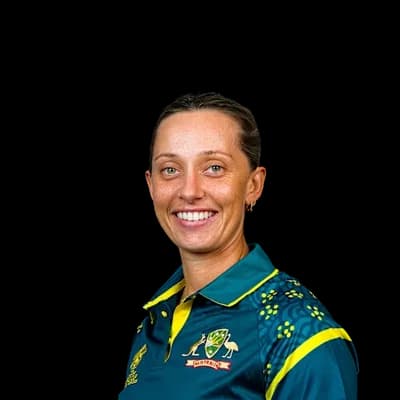 Ashleigh Gardner141
 Amy Satterthwaite96
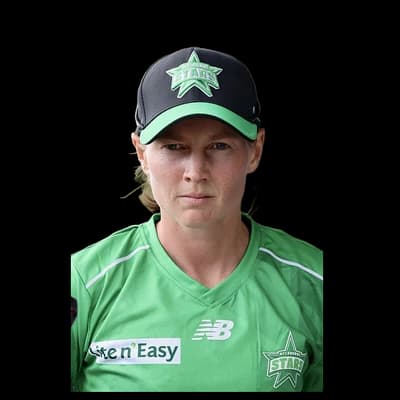 Meg Lanning90
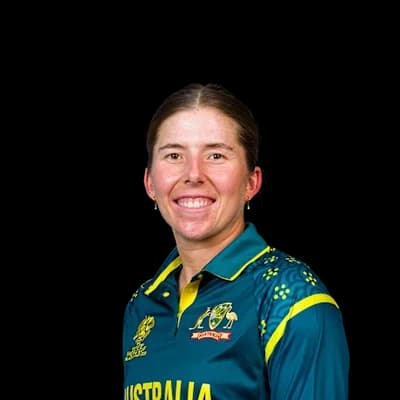 Georgia Wareham9
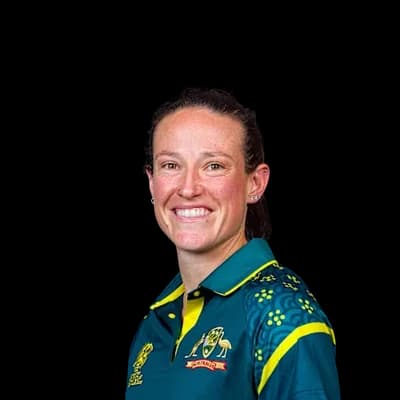 Megan Schutt7
 Delissa Kimmince7
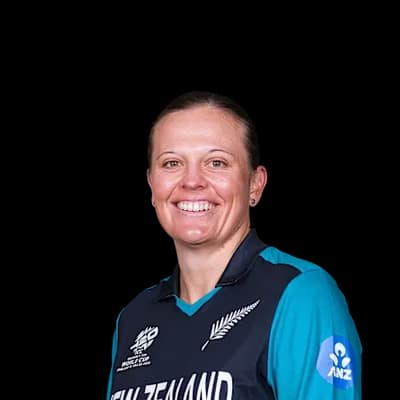 Lea Tahuhu5
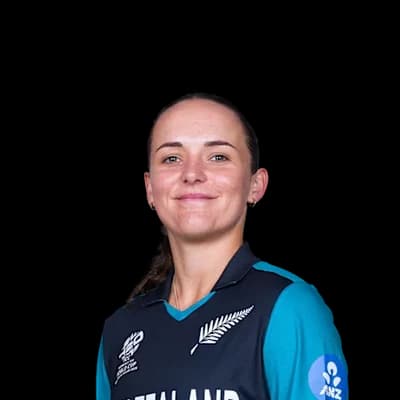 Amelia Kerr5
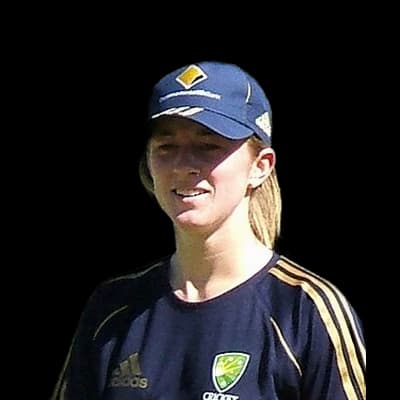 Rachael Haynes489
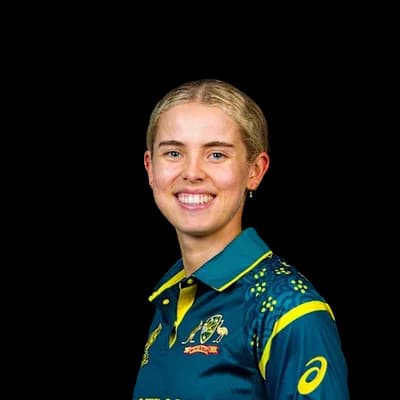 Phoebe Litchfield435Alyssa Healy429Meg Lanning368
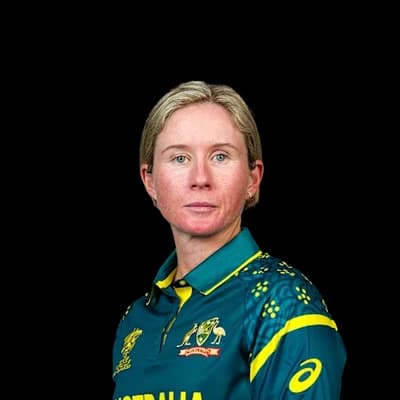 Beth Mooney366Megan Schutt28Ashleigh Gardner19
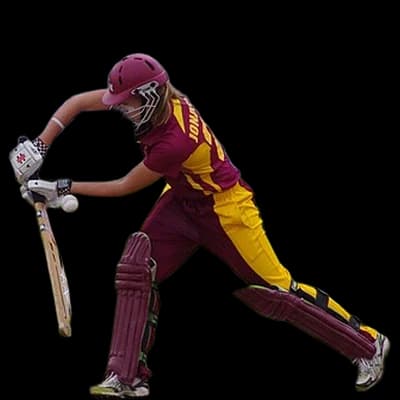 Jess Jonassen17
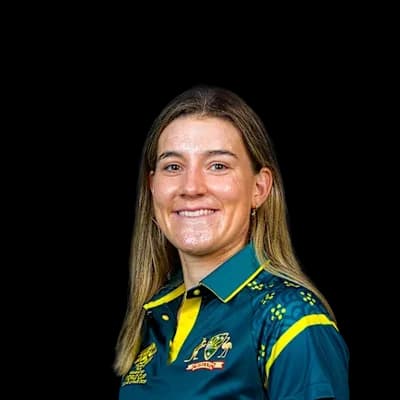 Annabel Sutherland16Georgia Wareham11Beth Mooney582Jess Jonassen409
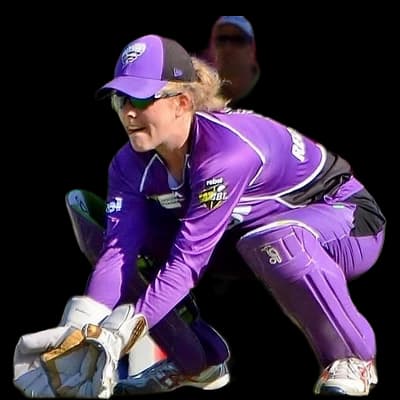 Georgia Redmayne396
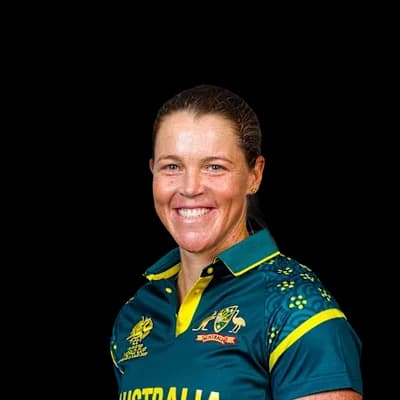 Grace Harris324Meg Lanning254Jess Jonassen39Nicola Hancock21
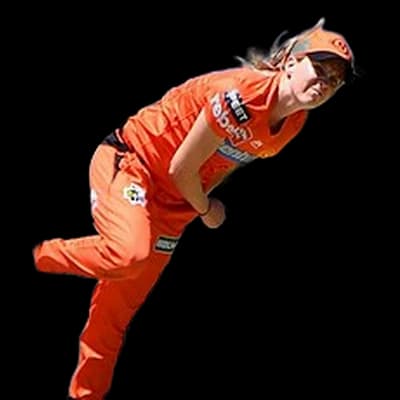 Jemma Barsby15
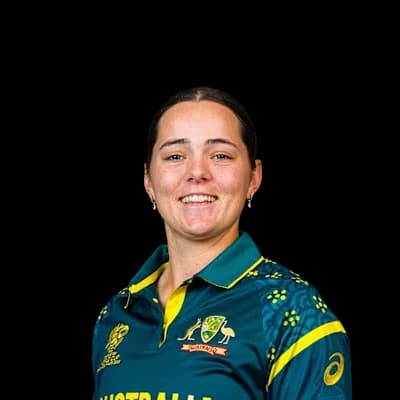 Lucy Hamilton11Amelia Kerr10
 Marnus Labuschagne431
 Matt Renshaw315
 Hugh Weibgen279Lachlan Hearne273Caleb Jewell248
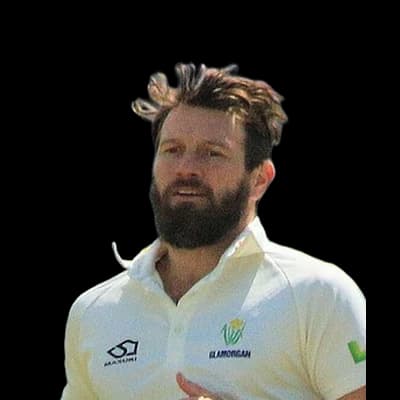 Michael Neser13Tom Straker13Mitchell Swepson13Riley Meredith9Tom Stewart Rogers8
Photos: ICC, New Zealand Government, Office of the Governor-General, CC0, via Wikimedia Commons, Yu Chu Chin, CC BY-SA 4.0, via Wikimedia Commons, YellowMonkey, CC BY-SA 3.0, via Wikimedia Commons, Naparazzi, CC BY-SA 2.0, via Wikimedia Commons, Bahnfrend, CC BY-SA 4.0, via Wikimedia Commons, Dave Morton, Public domain, via Wikimedia Commons
20°C
overcast
Feels 23°C · Humidity 98% · Wind 3.2 km/h · Cloud 100%
Rain outlook: no rain expected
Dew: likely – Heavy dew is likely from about 01:00; the side bowling second may find the ball wet.
| Month | High | Low | Rain mm | Rain days |
|---|---|---|---|---|
| January | 30° | 21° | 125.9 | 15.6 |
| February | 29° | 21° | 163 | 12.6 |
| March | 28° | 20° | 194.3 | 16.5 |
| April | 26° | 17° | 54.5 | 8.7 |
| May | 23° | 14° | 79.7 | 8.5 |
| June | 21° | 11° | 44.6 | 6.6 |
| July | 21° | 10° | 39.8 | 5.8 |
| August | 23° | 11° | 31.2 | 5.3 |
| September | 25° | 13° | 41.2 | 6.1 |
| October | 27° | 16° | 116.8 | 10.5 |
| November | 28° | 18° | 114.8 | 11.5 |
| December | 29° | 20° | 116.8 | 12.5 |
| Team | Format | P | W | L | Win % | Avg | Highest |
|---|---|---|---|---|---|---|---|
| Brisbane Heat | T20 | 26 | 13 | 13 | 50% | 139 | 184 |
| Australia | ODI | 13 | 13 | 0 | 100% | 217 | 371 |
| Queensland | First-class | 13 | 4 | 3 | 31% | 276 | 612 |
| Queensland | List A | 13 | 6 | 4 | 46% | 274 | 358 |
| Queensland Fire Women | List A | 11 | 3 | 2 | 27% | 204 | 288 |
| Perth Scorchers | T20 | 8 | 4 | 4 | 50% | 139 | 192 |
| Adelaide Strikers | T20 | 7 | 5 | 2 | 71% | 121 | 161 |
| Australia | T20I | 6 | 5 | 1 | 83% | 146 | 190 |
Bangladesh Women 172/10 (49.5) · Australia Women 175/2 (22.4)
Bangladesh Women 220/6 (50.0) · Australia Women 222/1 (28.1)
AUS-W won by 9 wickets
Bangladesh Women 166/10 (49.4) · Australia Women 168/3 (25.4)
AUS-W won by 7 wickets
Queensland 358/10 (49.5) · New South Wales 359/6 (49.0)
NSW won by 4 wickets
Queensland 335/7 (50.0) · Victoria 339/7 (49.5)
VIC won by 3 wickets
The average first-innings score at Allan Border Field in ODIs is 210, across 17 matches in our records. The par score (middle of the last 10 first innings) is 172.
In ODIs at Allan Border Field, sides batting first have won 29% of decided matches (4) and chasing sides 71% (10). Chasing has the edge.
The highest ODI total at Allan Border Field is 371, and the lowest is 83.
The highest successful ODI chase at Allan Border Field is 255. The lowest total defended is 281.
Pace bowlers have taken 59% of the wickets (with a known bowling type) in ODIs at Allan Border Field, and spinners 41%.
Captains winning the toss in ODIs at Allan Border Field chose to field 43% of the time, and the toss winner went on to win 57% of matches.
Rachael Haynes has scored the most ODI runs at Allan Border Field: 489 in 7 innings, averaging 69.9.
Megan Schutt has taken the most ODI wickets at Allan Border Field: 28 in 14 innings at an economy of 3.79.
Counted from UC Cricket's own ball-by-ball records; rebuilt nightly. Weather refreshes every few minutes.


