Melbourne, Australia · Capacity 10,000 · Opened 1856 · 156 matches on record
T20I Evenly balanced between batting first and chasing at Junction Oval, based on 9 decided matches.
| Format | M | Avg 1st | Avg 2nd | Bat 1st won | Chased | Highest | Lowest | Top chase | Low defended | RR | Bdry % |
|---|---|---|---|---|---|---|---|---|---|---|---|
| T20I | 10 | 118 | 125 | 5 | 4 | 177 | 11 | 177 | 91 | 6.58 | 53.7 |
| ODI | 7 | 156 | 159 | 2 | 4 | 233 | 103 | 233 | 180 | 3.92 | 47.2 |
| T20 | 50 | 147 | 133 | 21 | 27 | 229 | 32 | 180 | 112 | 7.58 | 55.6 |
| List A | 25 | 241 | 213 | 11 | 11 | 383 | 104 | 289 | 183 | 5.36 | 50.5 |
| First-class | 19 | 312 | 343 | 6 | 5 | 671 | 104 | 373 | 169 | 3.13 | 52.9 |
| T10 | 22 | 102 | 94 | 13 | 9 | 146 | 68 | 118 | 85 | 10.11 | — |
Last first innings: 11/2, 91/8, 155/5, 91/10, 113/9
| Phase | Run rate | Wkts |
|---|---|---|
| powerplay | 6.39 | 25 |
| middle | 6.32 | 48 |
| death | 7.43 | 46 |
Based on 10 matches.
Last first innings: 180/10, 180/10, 103/10, 107/8, 163/10
| Phase | Run rate | Wkts |
|---|---|---|
| powerplay | 4.48 | 16 |
| middle | 3.73 | 48 |
| death | 4.21 | 14 |
Based on 7 matches.
Last first innings: 66/6, 130/9, 160/5, 150/10, 151/6
| Phase | Run rate | Wkts |
|---|---|---|
| powerplay | 6.81 | 129 |
| middle | 7.49 | 265 |
| death | 8.94 | 185 |
Based on 50 matches.
Last first innings: 311/10, 290/7, 285/10, 183/8, 245/8
| Phase | Run rate | Wkts |
|---|---|---|
| powerplay | 5.24 | 53 |
| middle | 5.14 | 183 |
| death | 7.09 | 77 |
Based on 25 matches.
Last first innings: 244/10, 198/10, 305/10, 256/10, 240/10
| Phase | Run rate | Wkts |
|---|---|---|
| first | 2.88 | 172 |
| middle | 3.06 | 242 |
| late | 3.55 | 180 |
Based on 19 matches.
Last first innings: 88/7, 99/6, 80/4, 94/6, 116/4
Based on 22 matches.
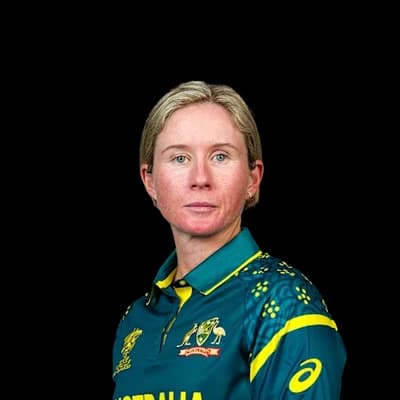 Beth Mooney197
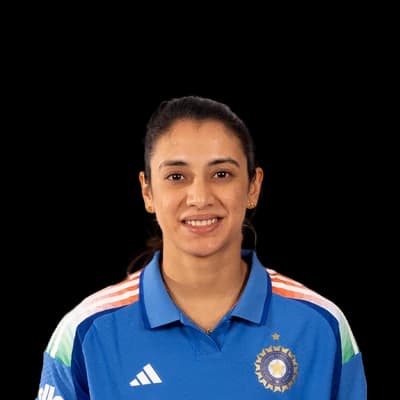 Smriti Mandhana194
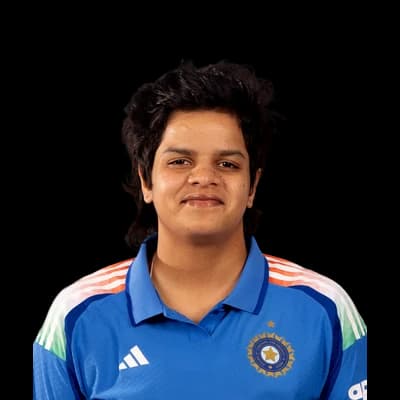 Shafali Verma160
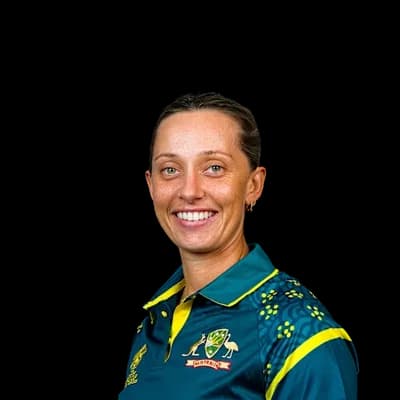 Ashleigh Gardner149
 Meg Lanning96
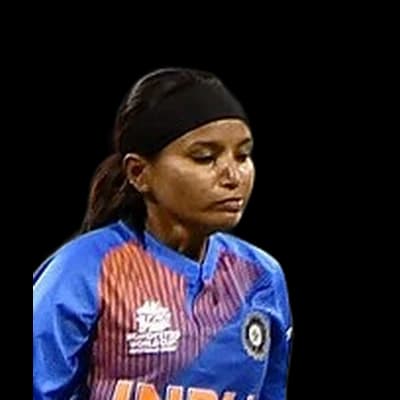 Rajeshwari Gayakwad9
 Radha Yadav8
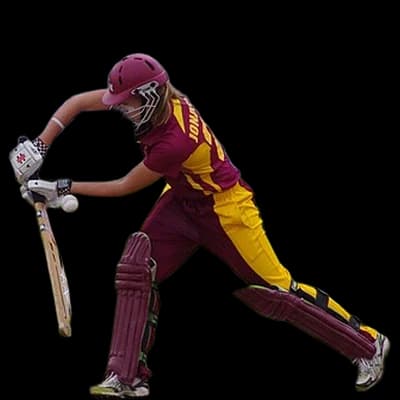 Jess Jonassen7
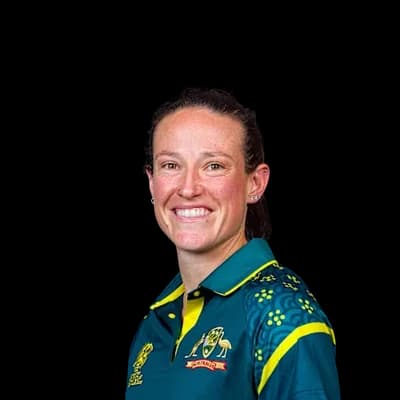 Megan Schutt6
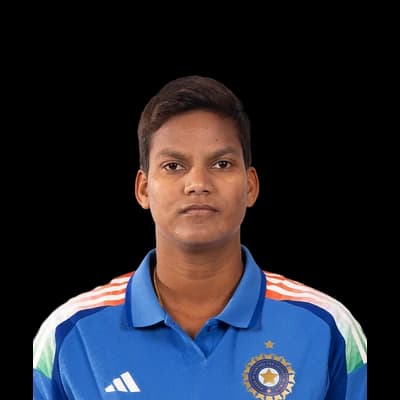 Deepti Sharma6
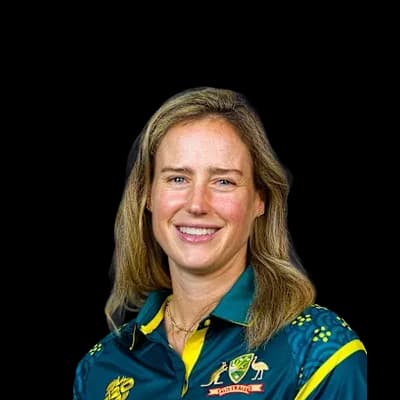 Ellyse Perry214
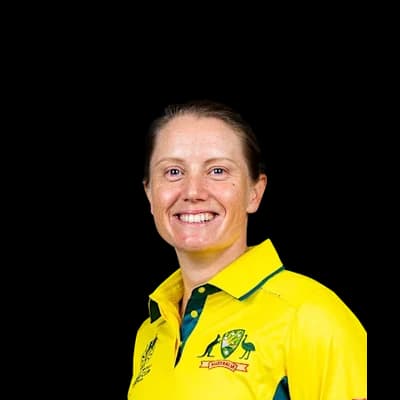 Alyssa Healy171Meg Lanning105
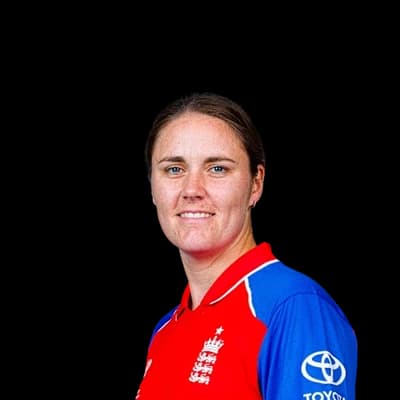 Natalie Sciver89
 Rachael Haynes87
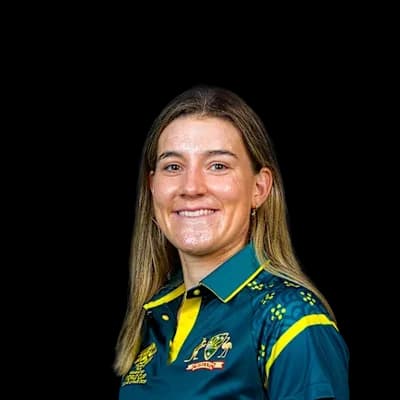 Annabel Sutherland11
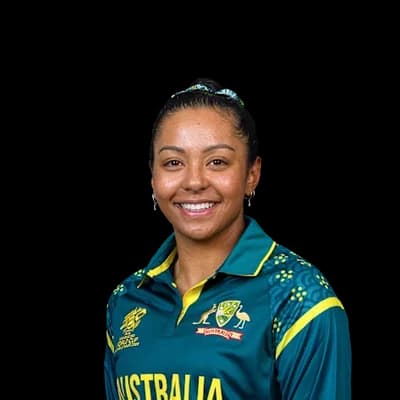 Alana King11
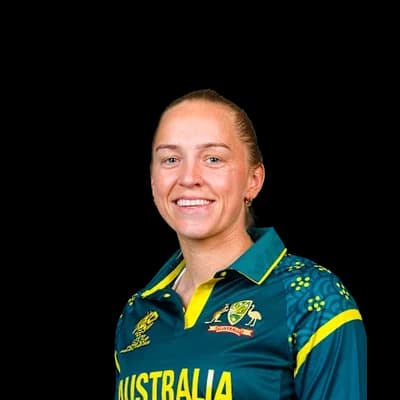 Kim Garth6
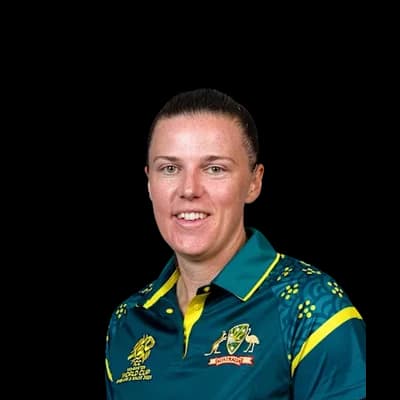 Tahlia McGrath6Ashleigh Gardner5Beth Mooney582Annabel Sutherland447
 Courtney Webb430
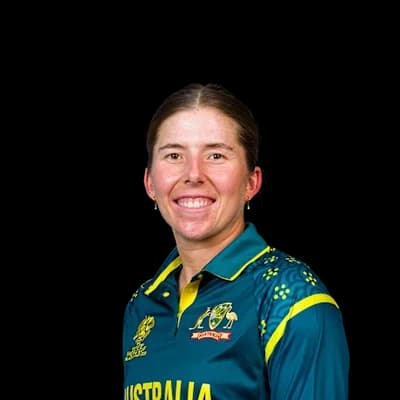 Georgia Wareham398Meg Lanning389Georgia Wareham26Annabel Sutherland23
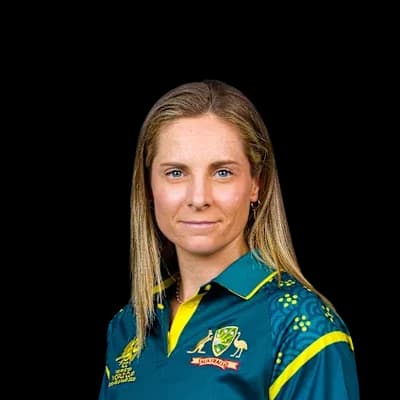 Sophie Molineux20
 Molly Strano18
 Sophie Day16
 Peter Handscomb555
 Sam Harper338
 Max Harris294Matthew Gilkes288Thomas Fraser Rogers278Sam Elliott21
 Todd Murphy15Fergus O'Neill13
 Will Sutherland13
 Peter Siddle13
Photos: ICC, BCCI, Yu Chu Chin, CC BY-SA 4.0, via Wikimedia Commons, Bahnfrend, CC BY-SA 4.0, via Wikimedia Commons, Naparazzi, CC BY-SA 2.0, via Wikimedia Commons, YellowMonkey, CC BY-SA 3.0, via Wikimedia Commons, Dave Morton, Public domain, via Wikimedia Commons, Storm machine, CC BY-SA 4.0, via Wikimedia Commons, @evermorestation on Twitter, CC BY-SA 4.0, via Wikimedia Commons, PrivateMusings, CC BY-SA 2.5, via Wikimedia Commons
13°C
clear
Feels 11°C · Humidity 65% · Wind 9.9 km/h · Cloud 10%
Rain outlook: showers possible
Dew: likely – Heavy dew is likely from about 22:00; the side bowling second may find the ball wet.
| Month | High | Low | Rain mm | Rain days |
|---|---|---|---|---|
| January | 26° | 16° | 66.1 | 8.5 |
| February | 25° | 15° | 38.6 | 6.2 |
| March | 24° | 14° | 50.6 | 8.3 |
| April | 20° | 11° | 65.8 | 9 |
| May | 16° | 9° | 63.4 | 10.9 |
| June | 14° | 7° | 68.8 | 12 |
| July | 13° | 7° | 62.1 | 13.5 |
| August | 14° | 7° | 71 | 13.3 |
| September | 17° | 8° | 70.8 | 12.3 |
| October | 19° | 10° | 88.1 | 12.4 |
| November | 21° | 12° | 99.5 | 11.5 |
| December | 24° | 13° | 70.8 | 9.6 |
| Team | Format | P | W | L | Win % | Avg | Highest |
|---|---|---|---|---|---|---|---|
| Melbourne Renegades | T20 | 27 | 15 | 11 | 56% | 138 | 181 |
| Melbourne Stars | T20 | 21 | 8 | 12 | 38% | 141 | 184 |
| Victoria | First-class | 20 | 8 | 3 | 40% | 277 | 616 |
| Victoria | List A | 19 | 8 | 7 | 42% | 225 | 333 |
| Perth Scorchers | T20 | 11 | 7 | 4 | 64% | 144 | 192 |
| Hobart Hurricanes | T20 | 10 | 4 | 6 | 40% | 137 | 176 |
| Melbourne Stars Academy | T10 | 10 | 6 | 4 | 60% | 101 | 120 |
| Victoria Women | List A | 10 | 0 | 4 | 0% | 214 | 293 |
New Zealand Women 11/2 (2.4)
South Australia 311/10 (49.3) · Victoria 241/9 (43.5)
SA won by 70 runs
Victoria 244/10 (84.3) · South Australia 508/10 (135.3) · Victoria 224/10 (90.4)
SA won by an inning and 40 runs
South Australia Women 290/7 (50.0) · Victoria Women 293/8 (49.3)
VIC-W won by 2 wickets
The average first-innings score at Junction Oval in T20Is is 118, across 10 matches in our records. The par score (middle of the last 10 first innings) is 132.
In T20Is at Junction Oval, sides batting first have won 56% of decided matches (5) and chasing sides 44% (4). Evenly balanced between batting first and chasing.
The highest T20I total at Junction Oval is 177, and the lowest is 11.
The highest successful T20I chase at Junction Oval is 177. The lowest total defended is 91.
Pace bowlers have taken 41% of the wickets (with a known bowling type) in T20Is at Junction Oval, and spinners 59%.
Captains winning the toss in T20Is at Junction Oval chose to field 56% of the time, and the toss winner went on to win 44% of matches.
Beth Mooney has scored the most T20I runs at Junction Oval: 197 in 4 innings, averaging 65.7.
Rajeshwari Gayakwad has taken the most T20I wickets at Junction Oval: 9 in 5 innings at an economy of 6.45.
Counted from UC Cricket's own ball-by-ball records; rebuilt nightly. Weather refreshes every few minutes.



