Melbourne, Australia · Capacity 56,771 · Opened 1997 · 80 matches on record
T20 Chasing has the edge at Docklands Stadium, based on 75 decided matches.
| Format | M | Avg 1st | Avg 2nd | Bat 1st won | Chased | Highest | Lowest | Top chase | Low defended | RR | Bdry % |
|---|---|---|---|---|---|---|---|---|---|---|---|
| ODI | 5 | 279 | 209 | 4 | 1 | 328 | 137 | 247 | 245 | 5.19 | 38.8 |
| T20 | 75 | 159 | 145 | 31 | 44 | 223 | 57 | 223 | 132 | 7.98 | 53.5 |
Last first innings: 281/7, 245/10, 293/5, 328/4, 246/9
| Phase | Run rate | Wkts |
|---|---|---|
| powerplay | 5.05 | 16 |
| middle | 4.71 | 45 |
| death | 7.07 | 19 |
Based on 5 matches.
Last first innings: 219/7, 166/7, 164/9, 196/4, 165/10
| Phase | Run rate | Wkts |
|---|---|---|
| powerplay | 7.40 | 241 |
| middle | 7.65 | 367 |
| death | 9.49 | 323 |
Based on 75 matches.
 Adam Gilchrist236
 Ricky Ponting225
 Michael Hussey155
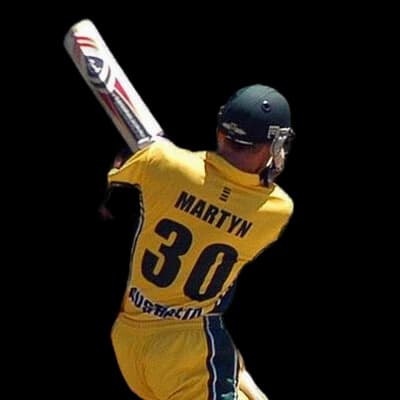 Damien Martyn133
 Andrew Symonds104
 Brett Lee16
 Shane Watson5
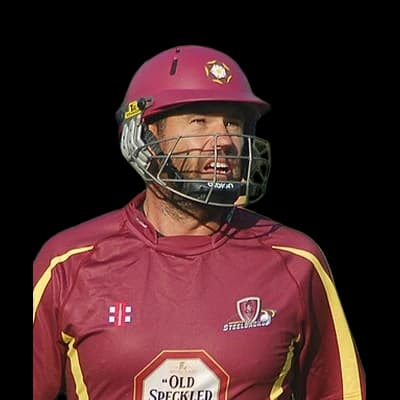 Andrew Hall5
 Johan van der Wath4
 Daniel Vettori4
 Aaron Finch1564
 Sam Harper658
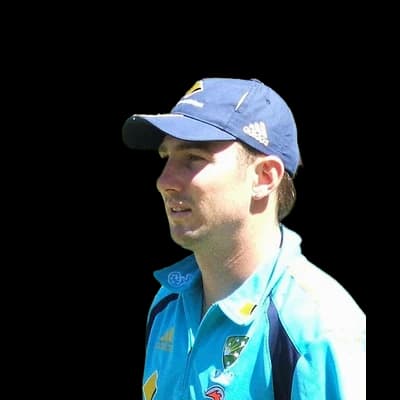 Shaun Marsh652
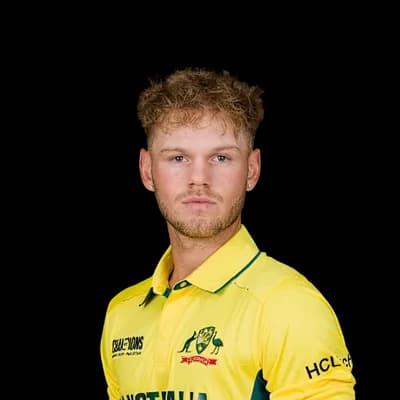 Jake Fraser-McGurk556
 Tom Cooper549
 Kane Richardson42Tom Stewart Rogers25
 Adam Zampa24
 Jason Behrendorff19Cameron Boyce19
Photos: Luton Anderson, CC BY-SA 2.0, via Wikimedia Commons, YellowMonkey/Blnguyen, CC BY-SA 4.0, via Wikimedia Commons, Taken with Nikon D100 by Wayne McLean archive copy at the Wayback Machine ( jgri, CC BY-SA 2.5, via Wikimedia Commons, WYD ebenedict.org Sydney, CC BY 2.0, via Wikimedia Commons, CC BY-SA 2.5, via Wikimedia Commons, paddynapper, CC BY-SA 2.0, via Wikimedia Commons, Pshoesmith, CC BY-SA 3.0, via Wikimedia Commons, Steelback at English Wikipedia, CC BY 3.0, via Wikimedia Commons, Benchill, CC BY-SA 3.0, via Wikimedia Commons, Supun47, CC BY-SA 3.0, via Wikimedia Commons, ICC, YellowMonkey, CC BY-SA 3.0, via Wikimedia Commons, CRICKETNEXT, CC BY 3.0, via Wikimedia Commons
13°C
overcast
Feels 12°C · Humidity 68% · Wind 7.5 km/h · Cloud 99%
Rain outlook: showers possible
Dew: likely – Heavy dew is likely from about 02:00; the side bowling second may find the ball wet.
| Month | High | Low | Rain mm | Rain days |
|---|---|---|---|---|
| January | 27° | 15° | 65 | 7.8 |
| February | 26° | 15° | 38.7 | 5.8 |
| March | 24° | 14° | 48.1 | 7.5 |
| April | 21° | 11° | 61.7 | 8.3 |
| May | 17° | 9° | 60.7 | 10.8 |
| June | 14° | 7° | 67.4 | 11.4 |
| July | 13° | 7° | 57.5 | 12.5 |
| August | 15° | 7° | 63.6 | 12.4 |
| September | 17° | 8° | 66.5 | 11.9 |
| October | 19° | 9° | 85.3 | 12.3 |
| November | 21° | 11° | 95.4 | 11.9 |
| December | 24° | 13° | 68.2 | 9.1 |
| Team | Format | P | W | L | Win % | Avg | Highest |
|---|---|---|---|---|---|---|---|
| Melbourne Renegades | T20 | 66 | 26 | 40 | 39% | 150 | 222 |
| Melbourne Stars | T20 | 15 | 10 | 5 | 67% | 157 | 200 |
| Perth Scorchers | T20 | 15 | 13 | 2 | 87% | 166 | 219 |
| Brisbane Heat | T20 | 13 | 5 | 8 | 38% | 152 | 196 |
| Hobart Hurricanes | T20 | 10 | 6 | 4 | 60% | 169 | 223 |
| Adelaide Strikers | T20 | 9 | 5 | 4 | 56% | 154 | 177 |
| Sydney Sixers | T20 | 9 | 5 | 4 | 56% | 150 | 180 |
| Sydney Thunder | T20 | 7 | 2 | 5 | 29% | 145 | 209 |
Perth Scorchers 219/7 (20.0) · Melbourne Renegades 169/8 (20.0)
Melbourne Renegades 166/7 (20.0) · Melbourne Stars 170/2 (15.5)
Melbourne Renegades 164/9 (20.0) · Sydney Sixers 168/4 (19.1)
Brisbane Heat 196/4 (20.0) · Melbourne Renegades 199/7 (18.0)
Melbourne Stars 165/10 (20.0) · Melbourne Renegades 123/10 (19.5)
The average first-innings score at Docklands Stadium in T20s is 159, across 75 matches in our records. The par score (middle of the last 10 first innings) is 165.
In T20s at Docklands Stadium, sides batting first have won 41% of decided matches (31) and chasing sides 59% (44). Chasing has the edge.
The highest T20 total at Docklands Stadium is 223, and the lowest is 57.
The highest successful T20 chase at Docklands Stadium is 223. The lowest total defended is 132.
Pace bowlers have taken 65% of the wickets (with a known bowling type) in T20s at Docklands Stadium, and spinners 35%.
Captains winning the toss in T20s at Docklands Stadium chose to field 61% of the time, and the toss winner went on to win 55% of matches.
Aaron Finch has scored the most T20 runs at Docklands Stadium: 1564 in 45 innings, averaging 40.1.
Kane Richardson has taken the most T20 wickets at Docklands Stadium: 42 in 30 innings at an economy of 7.72.
Counted from UC Cricket's own ball-by-ball records; rebuilt nightly. Weather refreshes every few minutes.
