Sydney, Australia · Capacity 43,649 · Opened 1851 · 205 matches on record
ODI Batting first has the edge at Sydney Cricket Ground, based on 45 decided matches.
| Format | M | Avg 1st | Avg 2nd | Bat 1st won | Chased | Highest | Lowest | Top chase | Low defended | RR | Bdry % |
|---|---|---|---|---|---|---|---|---|---|---|---|
| T20I | 25 | 164 | 127 | 16 | 7 | 221 | 41 | 200 | 133 | 8.10 | 53.7 |
| ODI | 49 | 266 | 217 | 28 | 17 | 408 | 6 | 334 | 213 | 5.56 | 44.3 |
| Test | 25 | 382 | 371 | 11 | 7 | 705 | 6 | 567 | 127 | 3.44 | 51.5 |
| T20 | 79 | 153 | 139 | 35 | 38 | 220 | 32 | 198 | 116 | 7.93 | 52.7 |
| List A | 1 | 344 | 170 | 1 | 0 | 344 | 170 | — | 344 | 6.24 | 53.7 |
| First-class | 17 | 302 | 250 | 9 | 2 | 489 | 4 | 276 | 211 | 3.04 | 46.8 |
Last first innings: 133/10, 133/10, 198/7, 198/7, 147/9
| Phase | Run rate | Wkts |
|---|---|---|
| powerplay | 8.10 | 76 |
| middle | 7.51 | 118 |
| death | 9.15 | 93 |
Based on 25 matches.
Last first innings: 236/10, 258/9, 280/8, 389/4, 374/6
| Phase | Run rate | Wkts |
|---|---|---|
| powerplay | 5.08 | 134 |
| middle | 5.23 | 372 |
| death | 7.78 | 194 |
Based on 49 matches.
Last first innings: 384/10, 185/10, 313/10, 475/4, 416/8
| Phase | Run rate | Wkts |
|---|---|---|
| first | 3.52 | 221 |
| middle | 3.29 | 255 |
| late | 3.53 | 283 |
Based on 25 matches.
Last first innings: 198/8, 189/6, 32/0, 144/10, 159/9
| Phase | Run rate | Wkts |
|---|---|---|
| powerplay | 7.44 | 246 |
| middle | 7.58 | 392 |
| death | 9.45 | 332 |
Based on 79 matches.
Last first innings: 202/10, 471/7, 382/10, 238/10, 211/10
| Phase | Run rate | Wkts |
|---|---|---|
| first | 3.03 | 212 |
| middle | 2.92 | 201 |
| late | 3.28 | 112 |
Based on 17 matches.
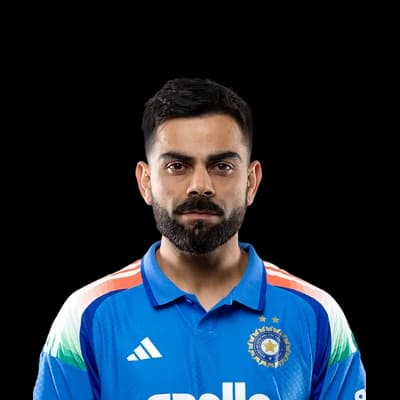 Virat Kohli298
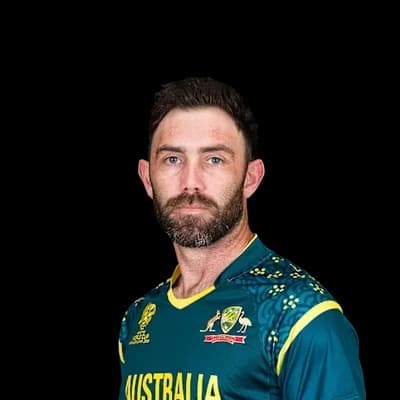 Glenn Maxwell203
 Shane Watson186
 Pathum Nissanka176
 Matthew Wade157
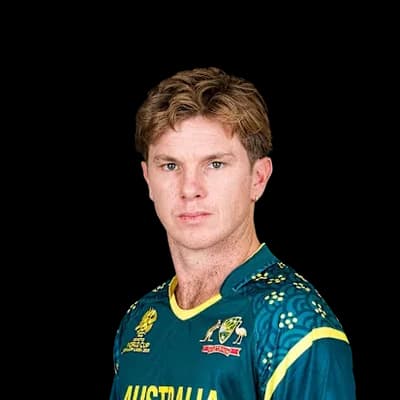 Adam Zampa11
 Trent Boult10
 Josh Hazlewood9
 Wanindu Hasaranga8
 Anrich Nortje8
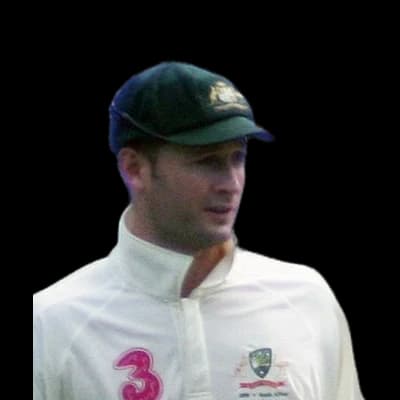 Michael Clarke976
 David Warner969
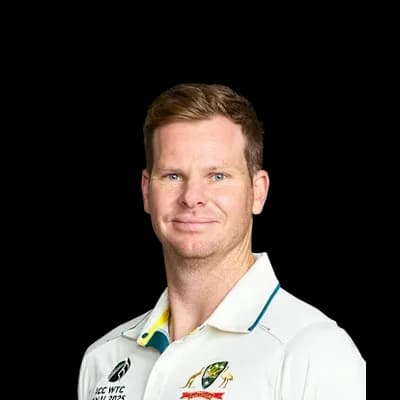 Steven Smith948
 Ricky Ponting578
 Aaron Finch551
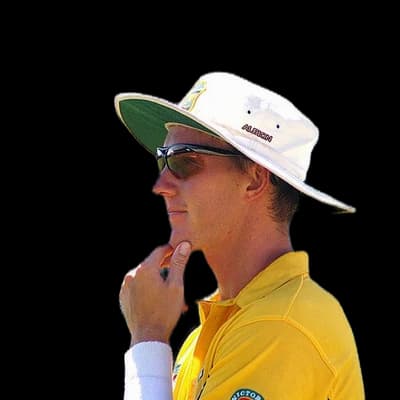 Brett Lee30Josh Hazlewood22
 Nathan Bracken20Adam Zampa19
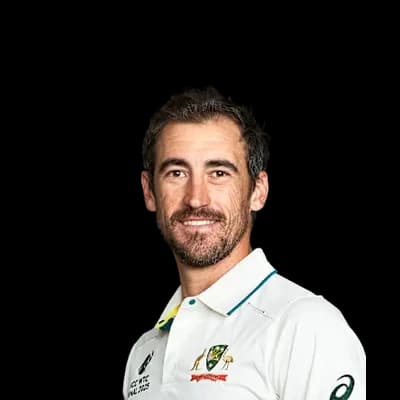 Mitchell Starc16Steven Smith1246Ricky Ponting974
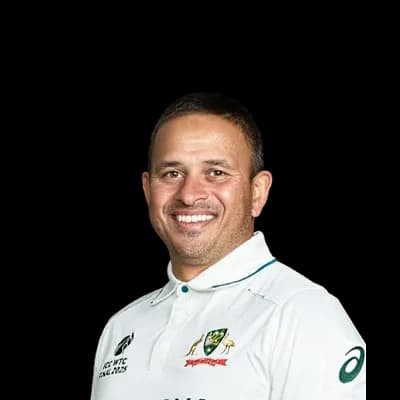 Usman Khawaja898David Warner884
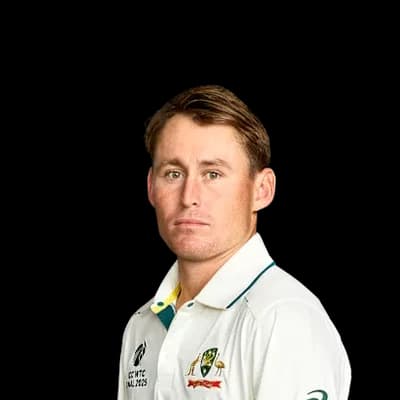 Marnus Labuschagne827
 Nathan Lyon49
 Pat Cummins36Mitchell Starc32Josh Hazlewood30Brett Lee30
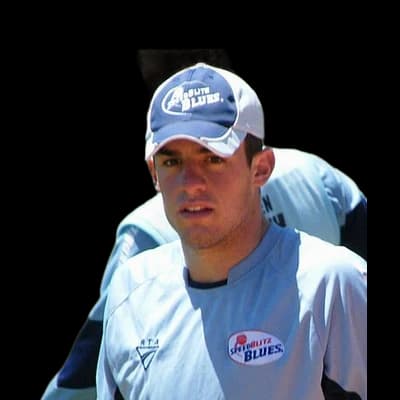 Moises Henriques1247
 Josh Philippe1091Jordan Silk953
 James Vince913Steven Smith897
 Sean Abbott90
 Ben Dwarshuis55
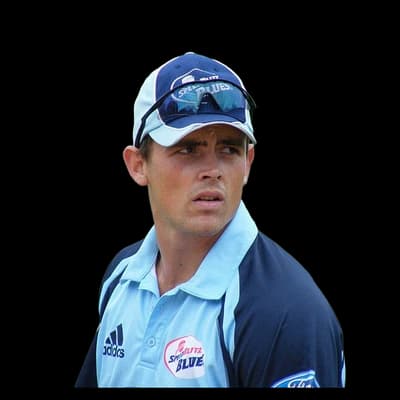 Steve O'Keefe45
 Tom Curran23
 Hayden Kerr22
Photos: BCCI, ICC, paddynapper, CC BY-SA 2.0, via Wikimedia Commons, IPL, self, CC BY-SA 2.5, via Wikimedia Commons, YellowMonkey/Blnguyen, CC BY-SA 4.0, via Wikimedia Commons, Supun47, CC BY-SA 3.0, via Wikimedia Commons, CC BY-SA 2.5, via Wikimedia Commons, Storm machine, CC BY-SA 4.0, via Wikimedia Commons, Ytfc23, CC BY-SA 4.0, via Wikimedia Commons
15°C
overcast
Feels 15°C · Humidity 95% · Wind 8.6 km/h · Cloud 96%
Rain outlook: no rain expected
Dew: likely – Heavy dew is likely from about 04:00; the side bowling second may find the ball wet.
| Month | High | Low | Rain mm | Rain days |
|---|---|---|---|---|
| January | 27° | 19° | 111.5 | 13.1 |
| February | 26° | 19° | 106.8 | 13.4 |
| March | 25° | 18° | 157.6 | 15.8 |
| April | 23° | 15° | 73 | 9.6 |
| May | 20° | 11° | 83.3 | 9.8 |
| June | 17° | 9° | 74.2 | 9.7 |
| July | 17° | 8° | 71.8 | 7.6 |
| August | 18° | 9° | 67.8 | 7.7 |
| September | 21° | 11° | 50.1 | 6.7 |
| October | 23° | 13° | 73.7 | 11.1 |
| November | 24° | 15° | 80.6 | 10.9 |
| December | 26° | 18° | 65.6 | 10.4 |
| Team | Format | P | W | L | Win % | Avg | Highest |
|---|---|---|---|---|---|---|---|
| Sydney Sixers | T20 | 74 | 42 | 23 | 57% | 148 | 220 |
| Australia | ODI | 45 | 30 | 11 | 67% | 267 | 389 |
| Australia | Test | 25 | 16 | 2 | 64% | 322 | 659 |
| New South Wales | First-class | 21 | 6 | 5 | 29% | 233 | 471 |
| Sydney Thunder | T20 | 15 | 3 | 9 | 20% | 137 | 202 |
| Australia | T20I | 14 | 7 | 4 | 50% | 151 | 221 |
| Perth Scorchers | T20 | 13 | 4 | 7 | 31% | 152 | 206 |
| India | ODI | 12 | 3 | 8 | 25% | 244 | 338 |
Australia 133/10 (18.0) · India 50/1 (5.1)
Australia Women 133/10 (18.0) · India Women 50/1 (5.1)
IND-W won by 21 runs (DLS Method)
New South Wales 202/10 (55.1) · South Australia 197/10 (62.5) · New South Wales 440/8 (123.0) · South Australia 118/2 (54.0)
draw
Sydney Sixers 198/8 (20.0) · Hobart Hurricanes 141/10 (17.2)
Sydney Thunder 189/6 (20.0) · Sydney Sixers 191/5 (17.2)
The average first-innings score at Sydney Cricket Ground in ODIs is 266, across 49 matches in our records. The par score (middle of the last 10 first innings) is 302.
In ODIs at Sydney Cricket Ground, sides batting first have won 62% of decided matches (28) and chasing sides 38% (17). Batting first has the edge.
The highest ODI total at Sydney Cricket Ground is 408, and the lowest is 6.
The highest successful ODI chase at Sydney Cricket Ground is 334. The lowest total defended is 213.
Pace bowlers have taken 73% of the wickets (with a known bowling type) in ODIs at Sydney Cricket Ground, and spinners 27%.
Captains winning the toss in ODIs at Sydney Cricket Ground chose to field 18% of the time, and the toss winner went on to win 56% of matches.
Michael Clarke has scored the most ODI runs at Sydney Cricket Ground: 976 in 25 innings, averaging 46.5.
Brett Lee has taken the most ODI wickets at Sydney Cricket Ground: 30 in 19 innings at an economy of 4.86.
Counted from UC Cricket's own ball-by-ball records; rebuilt nightly. Weather refreshes every few minutes.
