Melbourne, Australia · Capacity 1,00,024 · Opened 1885 · 204 matches on record
ODI Evenly balanced between batting first and chasing at Melbourne Cricket Ground, based on 39 decided matches.
| Format | M | Avg 1st | Avg 2nd | Bat 1st won | Chased | Highest | Lowest | Top chase | Low defended | RR | Bdry % |
|---|---|---|---|---|---|---|---|---|---|---|---|
| T20I | 25 | 143 | 127 | 9 | 15 | 186 | 69 | 172 | 127 | 7.36 | 47.6 |
| ODI | 40 | 257 | 222 | 18 | 21 | 355 | 77 | 308 | 184 | 5.19 | 39.5 |
| Test | 24 | 321 | 346 | 17 | 5 | 624 | 68 | 459 | 98 | 3.15 | 43.9 |
| T20 | 87 | 153 | 139 | 34 | 52 | 273 | 27 | 186 | 118 | 7.75 | 49.5 |
| List A | 3 | 183 | 176 | 1 | 2 | 216 | 108 | 216 | 132 | 4.98 | 40 |
| First-class | 14 | 222 | 188 | 8 | 2 | 454 | 89 | 255 | 149 | 2.75 | 43.8 |
Last first innings: 125/10, 137/8, 186/5, 157/10, 159/8
| Phase | Run rate | Wkts |
|---|---|---|
| powerplay | 7.09 | 81 |
| middle | 7.17 | 112 |
| death | 8.24 | 109 |
Based on 25 matches.
Last first innings: 203/10, 231/10, 355/5, 230/10, 304/8
| Phase | Run rate | Wkts |
|---|---|---|
| powerplay | 4.59 | 106 |
| middle | 4.98 | 277 |
| death | 6.88 | 197 |
Based on 40 matches.
Last first innings: 152/10, 170/10, 170/10, 474/10, 318/10
| Phase | Run rate | Wkts |
|---|---|---|
| first | 3.11 | 228 |
| middle | 3.01 | 285 |
| late | 3.43 | 232 |
Based on 24 matches.
Last first innings: 83/10, 128/10, 173/9, 158/9, 219/5
| Phase | Run rate | Wkts |
|---|---|---|
| powerplay | 7.34 | 270 |
| middle | 7.48 | 393 |
| death | 8.94 | 398 |
Based on 87 matches.
Last first innings: 215/10, 132/6, 202/10
| Phase | Run rate | Wkts |
|---|---|---|
| powerplay | 4.53 | 15 |
| middle | 5.15 | 19 |
| death | 5.14 | 6 |
Based on 3 matches.
Last first innings: 149/10, 194/10, 172/10, 272/10, 300/7
| Phase | Run rate | Wkts |
|---|---|---|
| first | 2.57 | 152 |
| middle | 2.82 | 191 |
| late | 2.93 | 125 |
Based on 14 matches.
 Aaron Finch334
 Meg Lanning218
 David Warner217
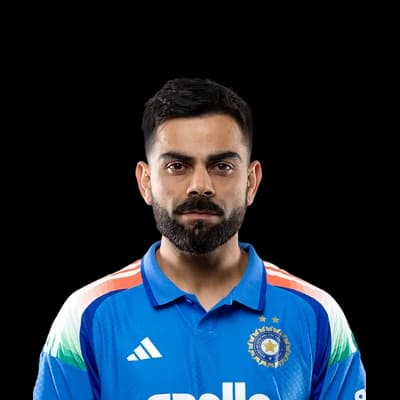 Virat Kohli198
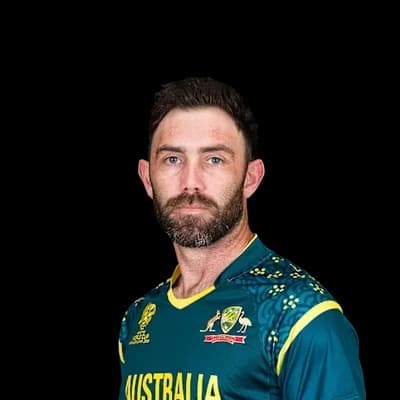 Glenn Maxwell146
 Kane Richardson9
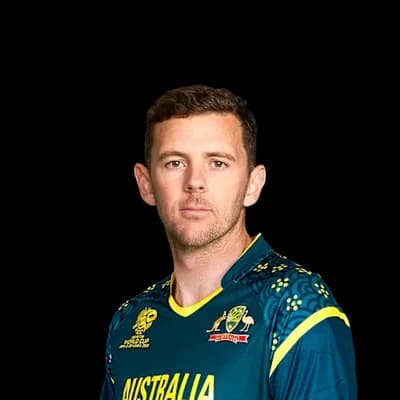 Josh Hazlewood7
 Shaun Tait6
 Hardik Pandya6
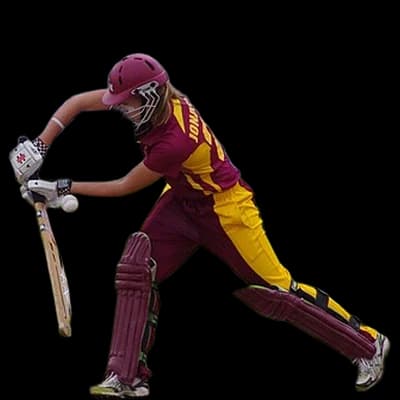 Jess Jonassen5
 Ricky Ponting699
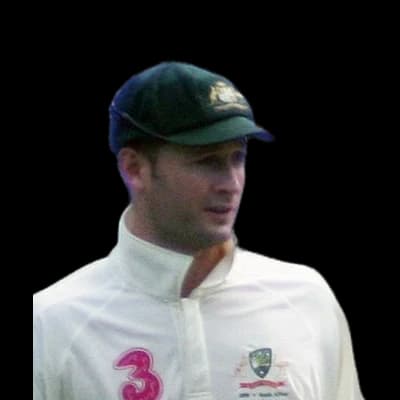 Michael Clarke615Aaron Finch536
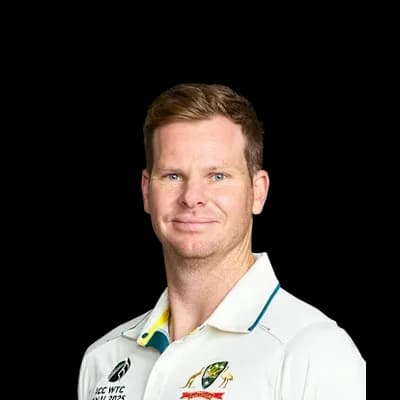 Steven Smith497David Warner454
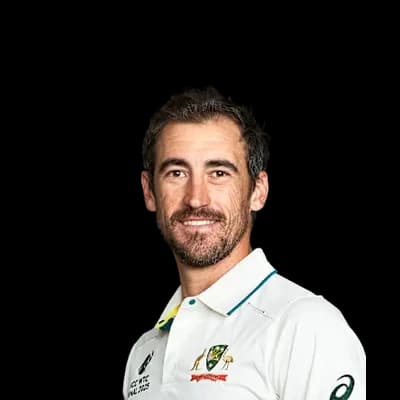 Mitchell Starc24
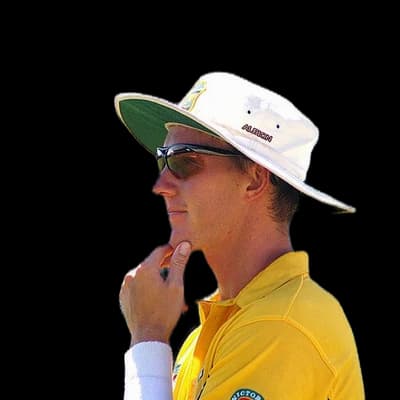 Brett Lee20
 Mitchell Johnson20
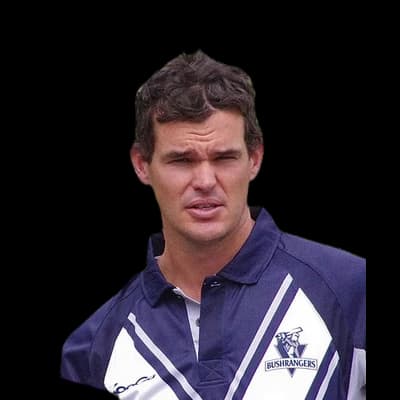 Clint McKay15
 Nathan Bracken13Steven Smith1279David Warner912
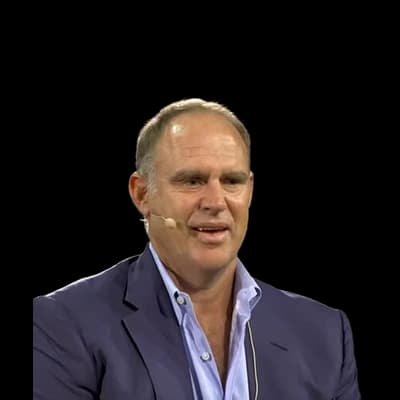 Matthew Hayden660Ricky Ponting614
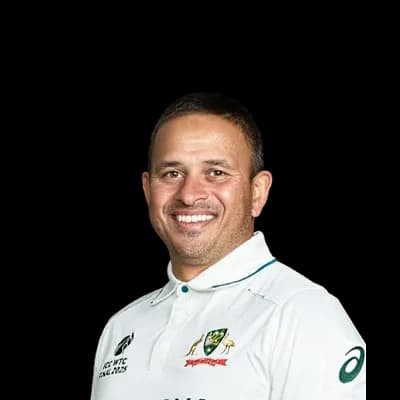 Usman Khawaja529
 Nathan Lyon50
 Pat Cummins41Mitchell Johnson32Mitchell Starc30
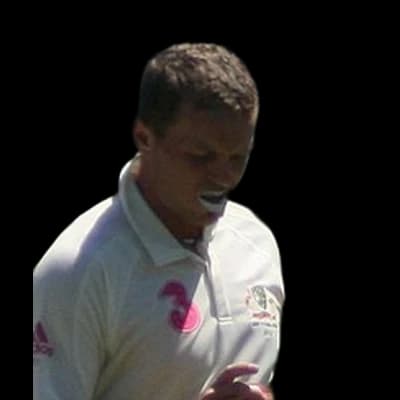 Peter Siddle26Glenn Maxwell1338
 Marcus Stoinis1317
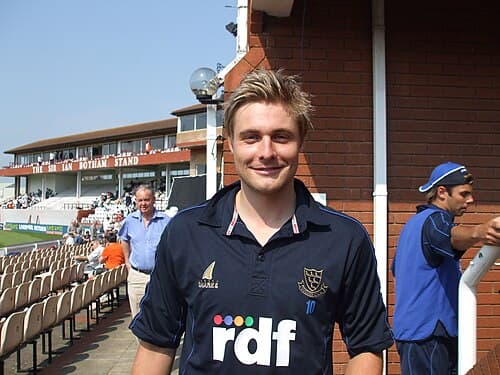 Luke Wright711
 Hilton Cartwright641Nick Larkin490
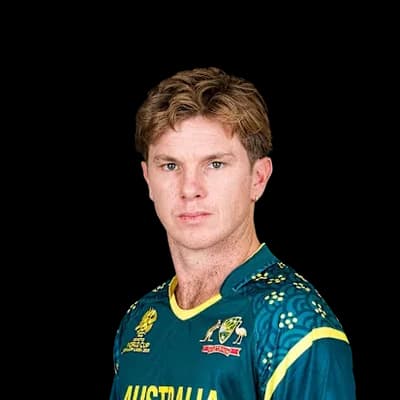 Adam Zampa48Marcus Stoinis26John Hastings24Nathan Coulter Nile24
 Scott Boland24
Photos: Supun47, CC BY-SA 3.0, via Wikimedia Commons, Yu Chu Chin, CC BY-SA 4.0, via Wikimedia Commons, YellowMonkey/Blnguyen, CC BY-SA 4.0, via Wikimedia Commons, BCCI, ICC, YellowMonkey, CC BY-SA 3.0, via Wikimedia Commons, Naparazzi, CC BY-SA 2.0, via Wikimedia Commons, self, CC BY-SA 2.5, via Wikimedia Commons, CC BY-SA 2.5, via Wikimedia Commons, paddynapper, CC BY-SA 2.0, via Wikimedia Commons, Indian yogi and author Sadhguru, on Youtube, CC BY 3.0, via Wikimedia Commons, PrivateMusings, CC BY-SA 2.5, via Wikimedia Commons, The Eternal Optimist (talk), CC BY-SA 3.0, via Wikimedia Commons
14°C
overcast
Feels 12°C · Humidity 59% · Wind 10 km/h · Cloud 95%
Rain outlook: showers possible
Dew: likely – Heavy dew is likely from about 22:00; the side bowling second may find the ball wet.
| Month | High | Low | Rain mm | Rain days |
|---|---|---|---|---|
| January | 26° | 16° | 66.1 | 8.5 |
| February | 25° | 15° | 38.6 | 6.2 |
| March | 24° | 14° | 50.6 | 8.3 |
| April | 20° | 11° | 65.8 | 9 |
| May | 16° | 9° | 63.4 | 10.9 |
| June | 14° | 7° | 68.8 | 12 |
| July | 13° | 7° | 62.1 | 13.5 |
| August | 14° | 7° | 71 | 13.3 |
| September | 17° | 8° | 70.8 | 12.3 |
| October | 19° | 10° | 88.1 | 12.4 |
| November | 21° | 12° | 99.5 | 11.5 |
| December | 24° | 13° | 70.8 | 9.6 |
| Team | Format | P | W | L | Win % | Avg | Highest |
|---|---|---|---|---|---|---|---|
| Melbourne Stars | T20 | 74 | 36 | 32 | 49% | 151 | 273 |
| Australia | ODI | 35 | 24 | 10 | 69% | 254 | 355 |
| Australia | Test | 22 | 15 | 5 | 68% | 314 | 624 |
| Melbourne Renegades | T20 | 19 | 7 | 9 | 37% | 150 | 177 |
| Australia | T20I | 17 | 10 | 5 | 59% | 136 | 182 |
| Hobart Hurricanes | T20 | 17 | 5 | 11 | 29% | 160 | 190 |
| Victoria | First-class | 17 | 6 | 4 | 35% | 229 | 454 |
| Sydney Sixers | T20 | 15 | 8 | 4 | 53% | 152 | 182 |
Queensland 149/10 (60.0) · Victoria 144/10 (57.2) · Queensland 236/10 (86.1) · Victoria 205/10 (85.1)
Queensland 215/10 (49.0) · Victoria 216/3 (44.3)
Adelaide Strikers 83/10 (19.3) · Melbourne Stars 86/5 (15.1)
Melbourne Stars 128/10 (19.5) · Sydney Sixers 129/4 (17.1)
Melbourne Stars 173/9 (20.0) · Melbourne Renegades 177/6 (19.5)
The average first-innings score at Melbourne Cricket Ground in ODIs is 257, across 40 matches in our records. The par score (middle of the last 10 first innings) is 264.
In ODIs at Melbourne Cricket Ground, sides batting first have won 46% of decided matches (18) and chasing sides 54% (21). Evenly balanced between batting first and chasing.
The highest ODI total at Melbourne Cricket Ground is 355, and the lowest is 77.
The highest successful ODI chase at Melbourne Cricket Ground is 308. The lowest total defended is 184.
Pace bowlers have taken 78% of the wickets (with a known bowling type) in ODIs at Melbourne Cricket Ground, and spinners 22%.
Captains winning the toss in ODIs at Melbourne Cricket Ground chose to field 33% of the time, and the toss winner went on to win 46% of matches.
Ricky Ponting has scored the most ODI runs at Melbourne Cricket Ground: 699 in 16 innings, averaging 49.9.
Mitchell Starc has taken the most ODI wickets at Melbourne Cricket Ground: 24 in 10 innings at an economy of 4.39.
Counted from UC Cricket's own ball-by-ball records; rebuilt nightly. Weather refreshes every few minutes.
