Sydney, Australia · 46 matches on record
List A Batting first has the edge at Cricket Central, based on 17 decided matches.
| Format | M | Avg 1st | Avg 2nd | Bat 1st won | Chased | Highest | Lowest | Top chase | Low defended | RR | Bdry % |
|---|---|---|---|---|---|---|---|---|---|---|---|
| T20 | 11 | 131 | 123 | 2 | 6 | 193 | 85 | 151 | 121 | 6.73 | 54.7 |
| List A | 20 | 245 | 216 | 10 | 7 | 332 | 25 | 311 | 166 | 5.30 | 48 |
| First-class | 7 | 277 | 440 | 1 | 0 | 623 | 139 | — | 391 | 3.19 | 49.9 |
Last first innings: 149/8, 152/9, 116/6, 193/4, 92/10
| Phase | Run rate | Wkts |
|---|---|---|
| powerplay | 6.07 | 18 |
| middle | 6.74 | 30 |
| death | 8.40 | 23 |
Based on 11 matches.
Last first innings: 25/0, 285/4, 167/10, 332/7, 246/8
| Phase | Run rate | Wkts |
|---|---|---|
| powerplay | 4.79 | 33 |
| middle | 5.19 | 109 |
| death | 6.59 | 34 |
Based on 20 matches.
Last first innings: 245/10, 232/10, 391/9, 239/10, 366/10
| Phase | Run rate | Wkts |
|---|---|---|
| first | 2.97 | 51 |
| middle | 3.19 | 66 |
| late | 3.39 | 75 |
Based on 7 matches.
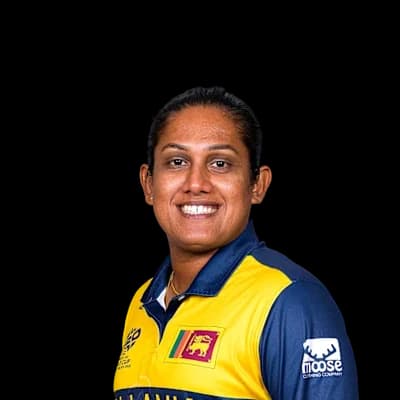 Chamari Athapaththu157
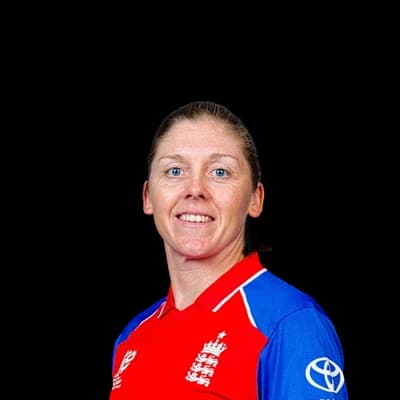 Heather Knight83
 Chloe Piparo79
 Laura Wolvaardt70
 Laura Harris63Frankie Nicklin4
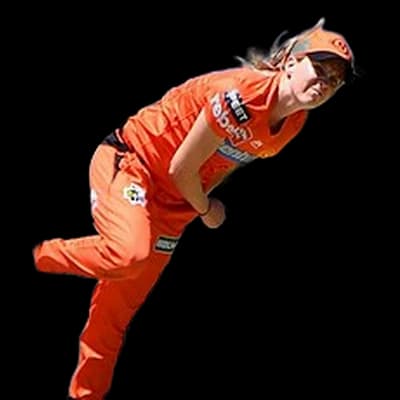 Jemma Barsby4
 Lilly Mills4
 Lauren Cheatle3
 Chloe Ainsworth3
 Matthew Gilkes324Kurtis Patterson289Josh Philippe286Lachlan Shaw192
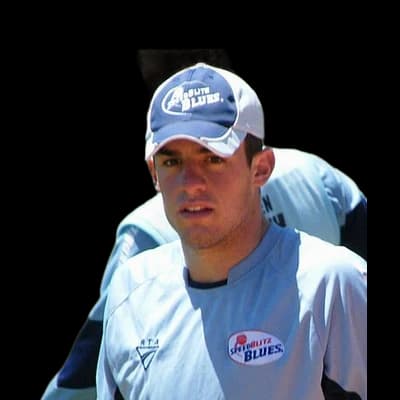 Moises Henriques170
 Tanveer Sangha13
 Chris Green8
 Andrew Tye7William Salzmann7Ayaka Kato-Stafford7Oliver Davies537Jack Edwards467
 Sam Konstas392Kurtis Patterson389
 Nathan McSweeney302Jack Edwards16Tanveer Sangha9
 Liam Hatcher9Chris Tremain8
 Nathan Lyon8
Photos: ICC, Bahnfrend, CC BY-SA 4.0, via Wikimedia Commons, paddynapper, CC BY-SA 2.0, via Wikimedia Commons, Servite et contribuere, CC0, via Wikimedia Commons, www.davidmolloyphotography.com from Sydney, Australia, CC BY 2.0, via Wikimedia Commons, DustyNail, CC BY-SA 4.0, via Wikimedia Commons
20°C
light drizzle
Feels 21°C · Humidity 62% · Wind 8.8 km/h · Cloud 75%
Rain outlook: rain very likely to interrupt
Dew: likely – Heavy dew is likely from about 22:00; the side bowling second may find the ball wet.
| Month | High | Low | Rain mm | Rain days |
|---|---|---|---|---|
| January | 29° | 19° | 96.9 | 13.5 |
| February | 29° | 19° | 121.8 | 12.8 |
| March | 27° | 18° | 168.9 | 16 |
| April | 24° | 14° | 64.9 | 11.5 |
| May | 21° | 11° | 70.9 | 9 |
| June | 18° | 9° | 52.3 | 7.6 |
| July | 18° | 8° | 46.4 | 6.2 |
| August | 20° | 8° | 41.6 | 7.3 |
| September | 23° | 10° | 44.6 | 6.4 |
| October | 25° | 13° | 72 | 11.2 |
| November | 27° | 15° | 72.8 | 11.5 |
| December | 29° | 18° | 83.7 | 11.3 |
| Team | Format | P | W | L | Win % | Avg | Highest |
|---|---|---|---|---|---|---|---|
| New South Wales Breakers Women | List A | 13 | 6 | 1 | 46% | 241 | 309 |
| New South Wales | List A | 11 | 4 | 4 | 36% | 243 | 310 |
| New South Wales | First-class | 7 | 0 | 1 | 0% | 343 | 510 |
| Queensland Fire Women | List A | 6 | 2 | 2 | 33% | 246 | 332 |
| Perth Scorchers Women | T20 | 4 | 1 | 0 | 25% | 127 | 134 |
| South Australia | List A | 4 | 1 | 2 | 25% | 188 | 242 |
| Western Australia | List A | 4 | 1 | 3 | 25% | 207 | 279 |
| Brisbane Heat Women | T20 | 3 | 1 | 1 | 33% | 97 | 105 |
Sydney Sixers Women 149/8 (20.0) · Perth Scorchers Women 134/7 (20.0)
SS-W won by 15 runs
Sydney Thunder Women 152/9 (20.0) · Sydney Sixers Women 153/6 (19.3)
SS-W won by 4 wickets
Adelaide Strikers Women 116/6 (20.0) · Perth Scorchers Women 118/5 (18.0)
PS W won by 5 wickets
Tasmania 25/0 (4.0)
Tasmania 245/10 (96.2) · New South Wales 500/9 (97.2) · Tasmania 402/5 (153.0)
Match Drawn
Queensland Fire Women 285/4 (50.0) · New South Wales Breakers Women 174/10 (38.5)
QF-W won by 111 runs
Queensland Fire Women 167/10 (38.0) · New South Wales Breakers Women 168/4 (25.0)
NSW-W won by 6 wickets
The average first-innings score at Cricket Central in List As is 245, across 20 matches in our records. The par score (middle of the last 10 first innings) is 274.
In List As at Cricket Central, sides batting first have won 59% of decided matches (10) and chasing sides 41% (7). Batting first has the edge.
The highest List A total at Cricket Central is 332, and the lowest is 25.
The highest successful List A chase at Cricket Central is 311. The lowest total defended is 166.
Pace bowlers have taken 63% of the wickets (with a known bowling type) in List As at Cricket Central, and spinners 37%.
Captains winning the toss in List As at Cricket Central chose to field 65% of the time, and the toss winner went on to win 53% of matches.
Matthew Gilkes has scored the most List A runs at Cricket Central: 324 in 8 innings, averaging 40.5.
Tanveer Sangha has taken the most List A wickets at Cricket Central: 13 in 6 innings at an economy of 5.2.
Counted from UC Cricket's own ball-by-ball records; rebuilt nightly. Weather refreshes every few minutes.
