Sydney, Australia · Capacity 1,000 · 24 matches on record
T20 Evenly balanced between batting first and chasing at Hurstville Oval, based on 18 decided matches.
| Format | M | Avg 1st | Avg 2nd | Bat 1st won | Chased | Highest | Lowest | Top chase | Low defended | RR | Bdry % |
|---|---|---|---|---|---|---|---|---|---|---|---|
| ODI | 2 | 248 | 222 | 1 | 1 | 256 | 203 | 241 | 256 | 4.71 | 41.8 |
| T20 | 21 | 133 | 116 | 10 | 8 | 206 | 77 | 150 | 110 | 6.64 | 48.5 |
Last first innings: 78/10, 136/3, 117/6, 137/8, 159/3
| Phase | Run rate | Wkts |
|---|---|---|
| powerplay | 6.13 | 51 |
| middle | 6.60 | 101 |
| death | 7.66 | 93 |
Based on 21 matches.
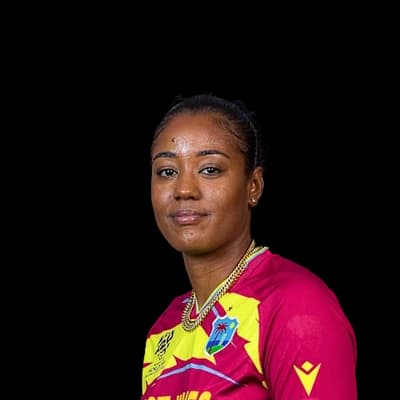 Hayley Matthews144
 Nicole Bolton135
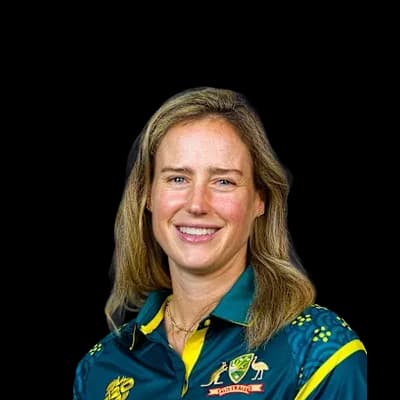 Ellyse Perry125
 Meg Lanning117
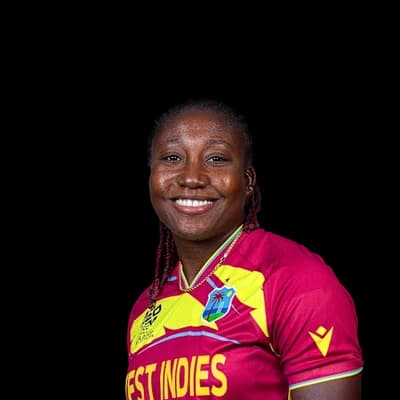 Stafanie Taylor95
 Erin Osborne5
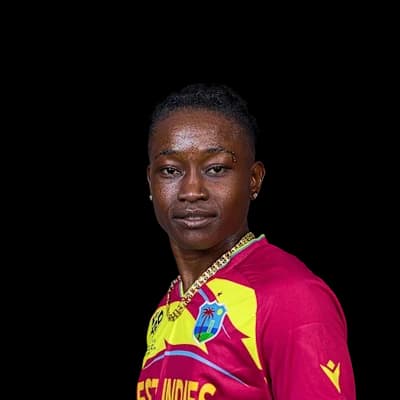 Deandra Dottin4Ellyse Perry3Hayley Matthews3
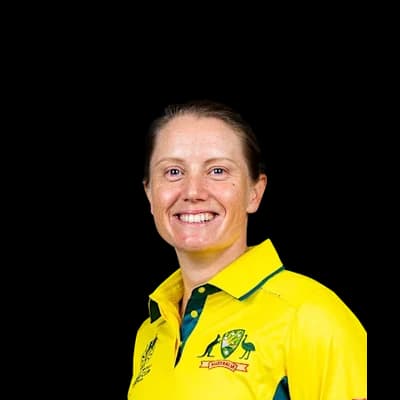 Alyssa Healy410
 Sophie Devine307Ellyse Perry180
 Erin Burns173
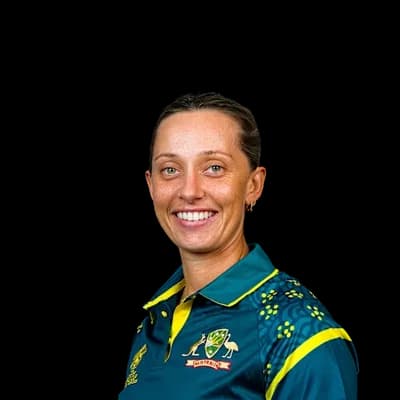 Ashleigh Gardner172
 Sarah Coyte17
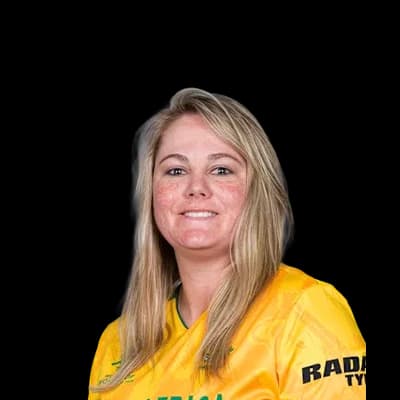 Dane van Niekerk9
 Marizanne Kapp8
 Sammy Jo Johnson8
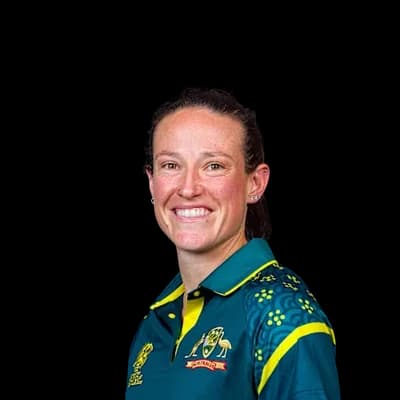 Megan Schutt7
Photos: ICC, Bahnfrend, CC BY-SA 4.0, via Wikimedia Commons, Yu Chu Chin, CC BY-SA 4.0, via Wikimedia Commons, YellowMonkey, CC BY-SA 3.0, via Wikimedia Commons, NAPARAZZI, CC BY-SA 2.0, via Wikimedia Commons
22°C
partly cloudy
Feels 21°C · Humidity 69% · Wind 23.1 km/h · Cloud 53%
Rain outlook: rain very likely to interrupt
Dew: likely – Heavy dew is likely from about 04:00; the side bowling second may find the ball wet.
| Month | High | Low | Rain mm | Rain days |
|---|---|---|---|---|
| January | 27° | 19° | 94.9 | 12.6 |
| February | 26° | 19° | 98.5 | 12.3 |
| March | 25° | 18° | 140.1 | 15.2 |
| April | 23° | 15° | 70.7 | 9.2 |
| May | 20° | 12° | 73 | 9.3 |
| June | 17° | 9° | 68.5 | 9 |
| July | 17° | 8° | 69.9 | 6.9 |
| August | 18° | 9° | 61.2 | 7.2 |
| September | 21° | 11° | 50.8 | 6.6 |
| October | 23° | 13° | 71.3 | 10.2 |
| November | 24° | 16° | 73.1 | 10.2 |
| December | 26° | 18° | 59.6 | 9.6 |
| Team | Format | P | W | L | Win % | Avg | Highest |
|---|---|---|---|---|---|---|---|
| Sydney Sixers | T20 | 10 | 7 | 3 | 70% | 134 | 206 |
| Adelaide Strikers | T20 | 7 | 3 | 4 | 43% | 125 | 164 |
| Hobart Hurricanes | T20 | 5 | 0 | 5 | 0% | 103 | 128 |
| Melbourne Stars | T20 | 4 | 2 | 1 | 50% | 136 | 159 |
| Brisbane Heat | T20 | 3 | 2 | 1 | 67% | 140 | 154 |
| Perth Scorchers | T20 | 3 | 1 | 2 | 33% | 154 | 183 |
| Australia | ODI | 2 | 2 | 0 | 100% | 249 | 256 |
| Australia A Women | T20 | 2 | 0 | 1 | 0% | 117 | 117 |
Melbourne Stars Women 78/10 (15.0) · Sydney Thunder Women 79/3 (9.4)
ST-W won by 7 wickets
Sydney Sixers Women 136/3 (20.0) · Brisbane Heat Women 90/10 (18.0)
SS-W won by 46 runs
The average first-innings score at Hurstville Oval in T20s is 133, across 21 matches in our records. The par score (middle of the last 10 first innings) is 137.
In T20s at Hurstville Oval, sides batting first have won 56% of decided matches (10) and chasing sides 44% (8). Evenly balanced between batting first and chasing.
The highest T20 total at Hurstville Oval is 206, and the lowest is 77.
The highest successful T20 chase at Hurstville Oval is 150. The lowest total defended is 110.
Pace bowlers have taken 59% of the wickets (with a known bowling type) in T20s at Hurstville Oval, and spinners 41%.
Captains winning the toss in T20s at Hurstville Oval chose to field 58% of the time, and the toss winner went on to win 33% of matches.
Alyssa Healy has scored the most T20 runs at Hurstville Oval: 410 in 10 innings, averaging 45.6.
Sarah Coyte has taken the most T20 wickets at Hurstville Oval: 17 in 8 innings at an economy of 5.14.
Counted from UC Cricket's own ball-by-ball records; rebuilt nightly. Weather refreshes every few minutes.
