Coffs Harbour, Australia · Capacity 20,000 · Opened 1994 · 7 matches on record
T20 Chasing has the edge at International Sports Stadium, based on 5 decided matches.
| Format | M | Avg 1st | Avg 2nd | Bat 1st won | Chased | Highest | Lowest | Top chase | Low defended | RR | Bdry % |
|---|---|---|---|---|---|---|---|---|---|---|---|
| ODI | 2 | 278 | 213 | 2 | 0 | 296 | 209 | — | 260 | 5.15 | 44.4 |
| T20 | 5 | 157 | 140 | 2 | 3 | 203 | 104 | 180 | 141 | 7.78 | 51 |
Last first innings: 114/9, 141/8, 203/5, 151/4, 176/6
| Phase | Run rate | Wkts |
|---|---|---|
| powerplay | 7.35 | 13 |
| middle | 7.45 | 32 |
| death | 9.11 | 16 |
Based on 5 matches.
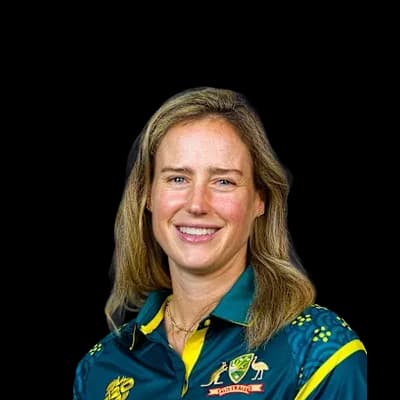 Ellyse Perry123
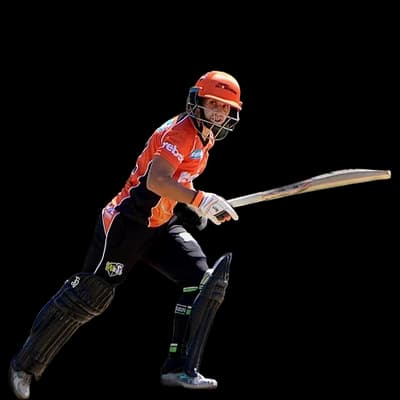 Nicole Bolton109
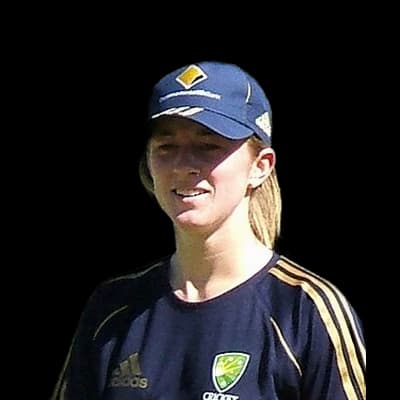 Rachael Haynes89
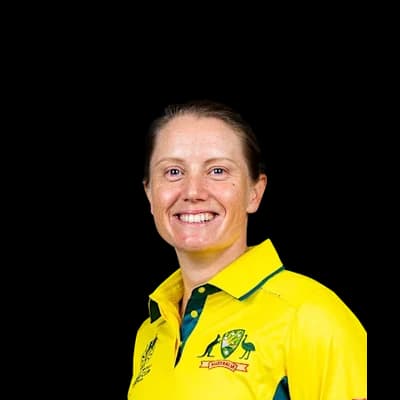 Alyssa Healy68
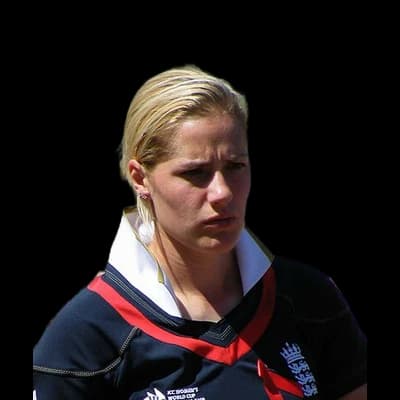 Katherine Brunt52
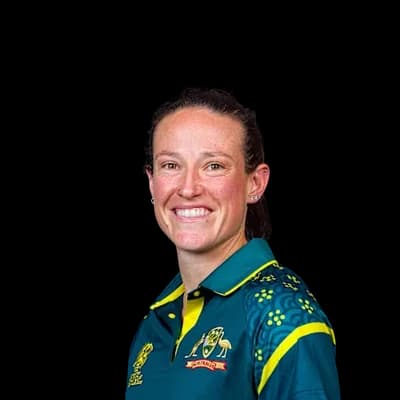 Megan Schutt5
 Jenny Gunn4
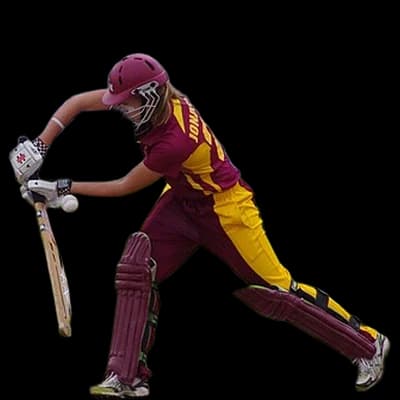 Jess Jonassen3
 Moseline Daniels3
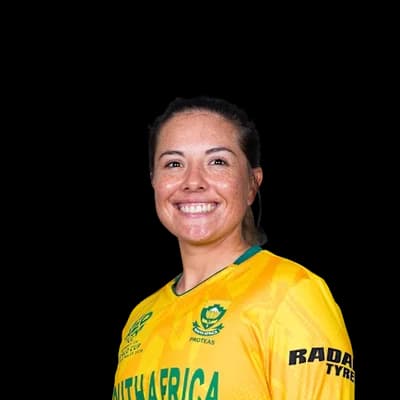 Sune Luus3
 Josh Philippe157
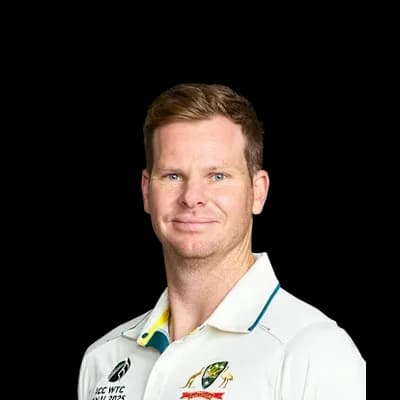 Steven Smith101
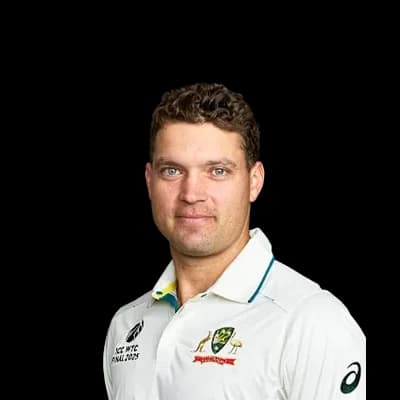 Alex Carey83Justin Avendano70
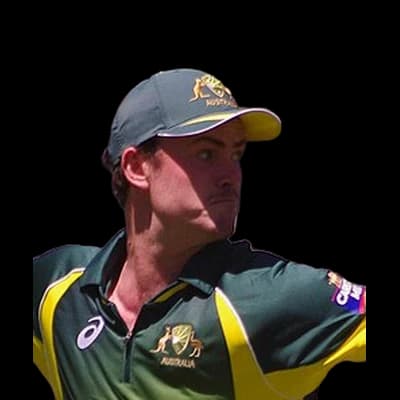 Ashton Turner69
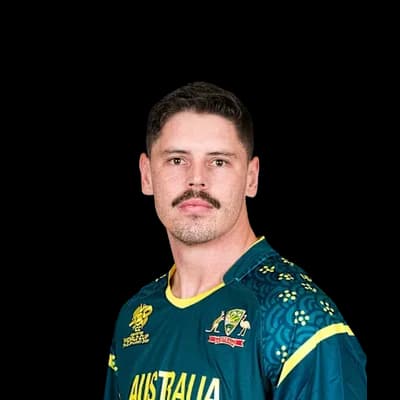 Ben Dwarshuis9
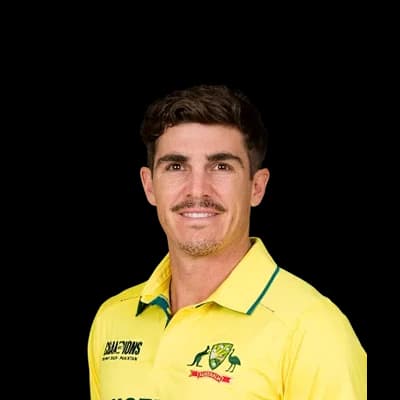 Sean Abbott4
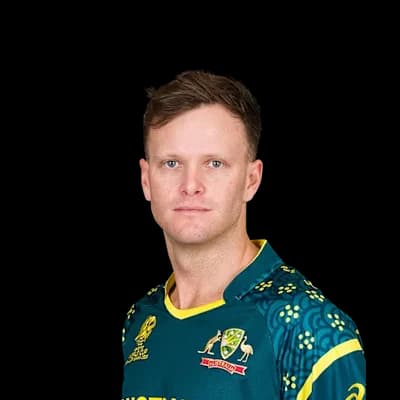 Matthew Kuhnemann4
 Steve O'Keefe3
 Todd Murphy3
Photos: ICC, Bahnfrend, CC BY-SA 4.0, via Wikimedia Commons, YellowMonkey, CC BY-SA 3.0, via Wikimedia Commons, paddynapper, CC BY-SA 2.0, via Wikimedia Commons, Naparazzi, CC BY-SA 2.0, via Wikimedia Commons, NAPARAZZI, CC BY-SA 2.0, via Wikimedia Commons, Storm machine, CC BY-SA 4.0, via Wikimedia Commons
22°C
overcast
Feels 19°C · Humidity 40% · Wind 10.8 km/h · Cloud 95%
Rain outlook: no rain expected
Dew: likely – Heavy dew is likely from about 00:00; the side bowling second may find the ball wet.
| Team | Format | P | W | L | Win % | Avg | Highest |
|---|---|---|---|---|---|---|---|
| Sydney Sixers | T20 | 5 | 3 | 2 | 60% | 159 | 203 |
| Adelaide Strikers | T20 | 2 | 0 | 2 | 0% | 160 | 176 |
| Australia | ODI | 2 | 2 | 0 | 100% | 278 | 296 |
| Brisbane Heat | T20 | 2 | 1 | 1 | 50% | 109 | 114 |
| England | ODI | 1 | 0 | 1 | 0% | 209 | 209 |
| Perth Scorchers | T20 | 1 | 1 | 0 | 100% | 152 | 152 |
| South Africa | ODI | 1 | 0 | 1 | 0% | 217 | 217 |
Brisbane Heat 114/9 (20.0) · Sydney Sixers 118/7 (18.4)
Sydney Sixers 141/8 (20.0) · Brisbane Heat 104/4 (14.3)
Sydney Sixers 203/5 (20.0) · Adelaide Strikers 144/10 (19.0)
Sydney Sixers 151/4 (20.0) · Perth Scorchers 152/5 (19.0)
Adelaide Strikers 176/6 (20.0) · Sydney Sixers 180/3 (19.3)
The average first-innings score at International Sports Stadium in T20s is 157, across 5 matches in our records. The par score (middle of the last 5 first innings) is 151.
In T20s at International Sports Stadium, sides batting first have won 40% of decided matches (2) and chasing sides 60% (3). Chasing has the edge.
The highest T20 total at International Sports Stadium is 203, and the lowest is 104.
The highest successful T20 chase at International Sports Stadium is 180. The lowest total defended is 141.
Pace bowlers have taken 58% of the wickets (with a known bowling type) in T20s at International Sports Stadium, and spinners 42%.
Captains winning the toss in T20s at International Sports Stadium chose to field 60% of the time, and the toss winner went on to win 40% of matches.
Josh Philippe has scored the most T20 runs at International Sports Stadium: 157 in 5 innings, averaging 39.2.
Ben Dwarshuis has taken the most T20 wickets at International Sports Stadium: 9 in 5 innings at an economy of 7.44.
Counted from UC Cricket's own ball-by-ball records; rebuilt nightly. Weather refreshes every few minutes.
