Perth, Australia · Capacity 60,000 · Opened 2017 · 76 matches on record
T20 Evenly balanced between batting first and chasing at Perth Stadium, based on 51 decided matches.
| Format | M | Avg 1st | Avg 2nd | Bat 1st won | Chased | Highest | Lowest | Top chase | Low defended | RR | Bdry % |
|---|---|---|---|---|---|---|---|---|---|---|---|
| T20I | 7 | 149 | 144 | 3 | 4 | 220 | 91 | 158 | 130 | 7.85 | 56.8 |
| ODI | 4 | 172 | 169 | 1 | 3 | 259 | 131 | 153 | 259 | 5.05 | 47.9 |
| Test | 7 | 335 | 223 | 5 | 2 | 598 | 28 | 323 | 150 | 3.31 | 46.8 |
| T20 | 51 | 160 | 144 | 24 | 27 | 213 | 79 | 201 | 146 | 8.06 | 56.5 |
Last first innings: 220/6, 91/10, 133/9, 130/8, 157/6
| Phase | Run rate | Wkts |
|---|---|---|
| powerplay | 6.99 | 21 |
| middle | 8.05 | 37 |
| death | 8.72 | 29 |
Based on 7 matches.
Last first innings: 136/9, 140/10, 152/10, 259/10
| Phase | Run rate | Wkts |
|---|---|---|
| powerplay | 4.85 | 11 |
| middle | 5.13 | 41 |
| death | 5.19 | 6 |
Based on 4 matches.
Last first innings: 198/10, 172/10, 150/10, 487/10, 598/4
| Phase | Run rate | Wkts |
|---|---|---|
| first | 3.22 | 74 |
| middle | 3.22 | 75 |
| late | 3.56 | 60 |
Based on 7 matches.
Last first innings: 132/10, 147/9, 130/10, 127/10, 153/8
| Phase | Run rate | Wkts |
|---|---|---|
| powerplay | 7.32 | 173 |
| middle | 7.74 | 281 |
| death | 9.87 | 211 |
Based on 51 matches.
 David Warner213
 Aaron Finch95
 Marcus Stoinis94
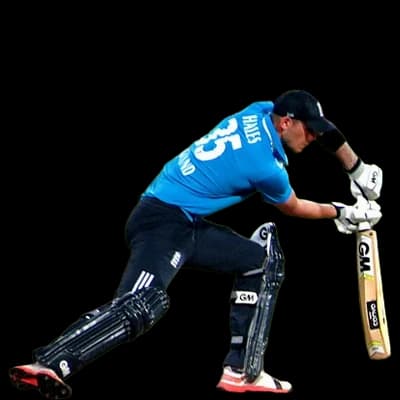 Alex Hales84
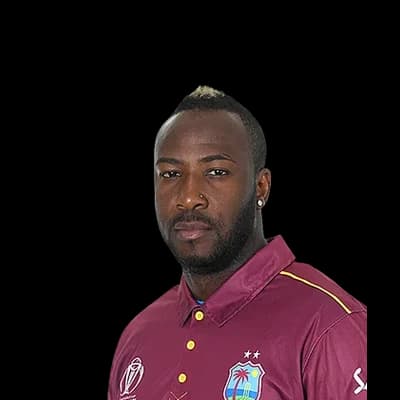 Andre Russell71Marcus Stoinis109
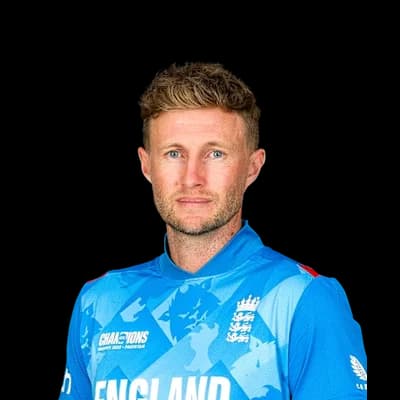 Joe Root62
 Mitchell Marsh59
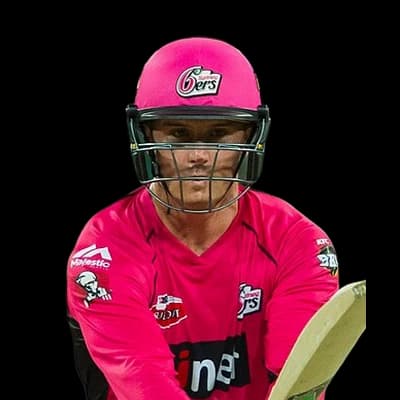 Jason Roy49
 Quinton De Kock47
 Andrew Tye5
 Tom Curran5
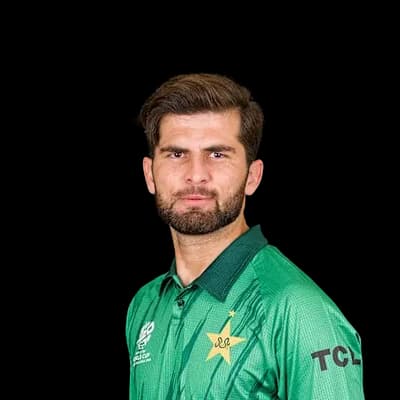 Shaheen Afridi3
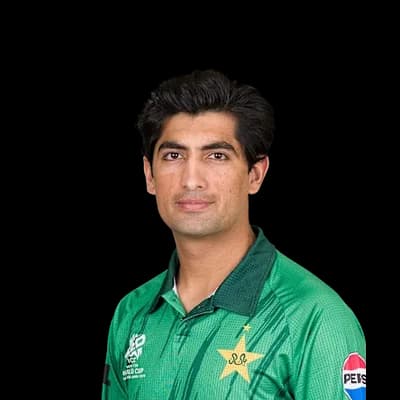 Naseem Shah3
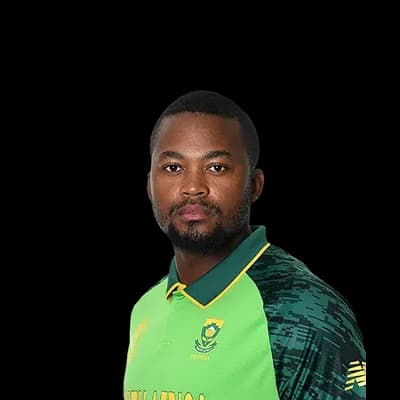 Andile Phehlukwayo3
 Marnus Labuschagne584
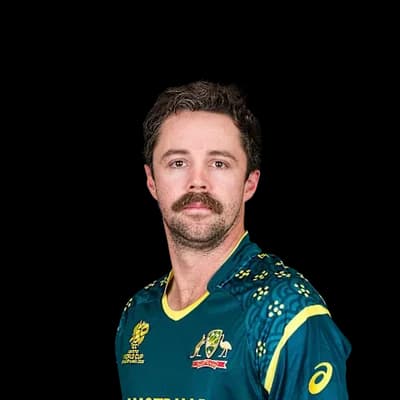 Travis Head535
 Steven Smith391
 Usman Khawaja293David Warner279
 Mitchell Starc36
 Nathan Lyon29
 Josh Hazlewood16
 Pat Cummins15
 Jasprit Bumrah13
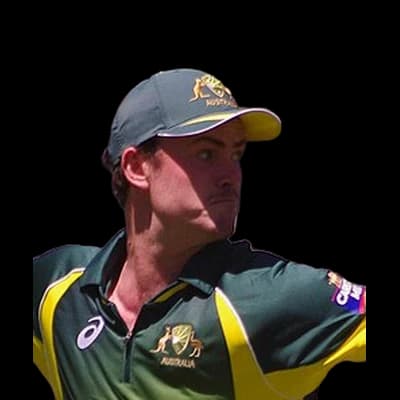 Ashton Turner854
 Aaron Hardie778
 Josh Inglis624
 Cameron Bancroft547Mitchell Marsh504Andrew Tye48
 Jhye Richardson43
 Jason Behrendorff43Thomas Kelly25Lance Morris25
Photos: YellowMonkey/Blnguyen, CC BY-SA 4.0, via Wikimedia Commons, Supun47, CC BY-SA 3.0, via Wikimedia Commons, ICC, Amal316, CC BY-SA 4.0, via Wikimedia Commons, YellowMonkey, CC BY-SA 3.0, via Wikimedia Commons, Joeyjackets, CC BY-SA 4.0, via Wikimedia Commons, www.davidmolloyphotography.com from Sydney, Australia, CC BY 2.0, via Wikimedia Commons, Ytfc23, CC BY-SA 4.0, via Wikimedia Commons, BCCI, NAPARAZZI, CC BY-SA 2.0, via Wikimedia Commons, CRICKETNEXT, CC BY 3.0, via Wikimedia Commons
23°C
clear
Feels 22°C · Humidity 34% · Wind 9.4 km/h · Cloud 0%
Rain outlook: no rain expected
Dew: unlikely – No dew expected this evening.
| Month | High | Low | Rain mm | Rain days |
|---|---|---|---|---|
| January | 32° | 19° | 21.3 | 1.5 |
| February | 32° | 19° | 22.9 | 2.3 |
| March | 30° | 18° | 41.7 | 4.7 |
| April | 25° | 15° | 32.7 | 5.9 |
| May | 22° | 12° | 78.1 | 7.5 |
| June | 18° | 10° | 114.8 | 12.5 |
| July | 18° | 10° | 119.3 | 14.8 |
| August | 18° | 9° | 125.5 | 12.8 |
| September | 20° | 11° | 52.5 | 7.9 |
| October | 22° | 12° | 45.1 | 6.6 |
| November | 27° | 15° | 24.4 | 4.5 |
| December | 31° | 18° | 8 | 1.5 |
| Team | Format | P | W | L | Win % | Avg | Highest |
|---|---|---|---|---|---|---|---|
| Perth Scorchers | T20 | 52 | 31 | 16 | 60% | 156 | 213 |
| Hobart Hurricanes | T20 | 9 | 4 | 4 | 44% | 163 | 210 |
| Sydney Sixers | T20 | 9 | 2 | 7 | 22% | 140 | 201 |
| Brisbane Heat | T20 | 8 | 1 | 6 | 12% | 154 | 179 |
| Melbourne Renegades | T20 | 8 | 3 | 4 | 38% | 152 | 202 |
| Adelaide Strikers | T20 | 7 | 2 | 5 | 29% | 144 | 181 |
| Sydney Thunder | T20 | 7 | 4 | 2 | 57% | 165 | 182 |
| Australia | Test | 6 | 5 | 1 | 83% | 282 | 598 |
India Women 198/10 (62.4) · Australia Women 323/10 (90.4) · India Women 149/10 (48.2) · Australia Women 28/0 (4.3)
AUS-W won by 10 wickets
Sydney Sixers 132/10 (20.0) · Perth Scorchers 133/4 (17.3)
Perth Scorchers 147/9 (20.0) · Sydney Sixers 99/10 (15.0)
Melbourne Stars 130/10 (18.2) · Perth Scorchers 134/4 (16.5)
Perth Scorchers 127/10 (19.2) · Melbourne Renegades 130/6 (20.0)
The average first-innings score at Perth Stadium in T20s is 160, across 51 matches in our records. The par score (middle of the last 10 first innings) is 147.
In T20s at Perth Stadium, sides batting first have won 47% of decided matches (24) and chasing sides 53% (27). Evenly balanced between batting first and chasing.
The highest T20 total at Perth Stadium is 213, and the lowest is 79.
The highest successful T20 chase at Perth Stadium is 201. The lowest total defended is 146.
Pace bowlers have taken 74% of the wickets (with a known bowling type) in T20s at Perth Stadium, and spinners 26%.
Captains winning the toss in T20s at Perth Stadium chose to field 65% of the time, and the toss winner went on to win 41% of matches.
Ashton Turner has scored the most T20 runs at Perth Stadium: 854 in 35 innings, averaging 31.6.
Andrew Tye has taken the most T20 wickets at Perth Stadium: 48 in 30 innings at an economy of 7.92.
Counted from UC Cricket's own ball-by-ball records; rebuilt nightly. Weather refreshes every few minutes.