Sydney, Australia · Capacity 25,000 · Opened 1998 · 65 matches on record
T20 Evenly balanced between batting first and chasing at Sydney Showground Stadium, based on 55 decided matches.
| Format | M | Avg 1st | Avg 2nd | Bat 1st won | Chased | Highest | Lowest | Top chase | Low defended | RR | Bdry % |
|---|---|---|---|---|---|---|---|---|---|---|---|
| T20I | 4 | 140 | 110 | 3 | 0 | 150 | 97 | — | 132 | 6.51 | 48.8 |
| T20 | 58 | 148 | 124 | 27 | 28 | 207 | 15 | 207 | 76 | 7.71 | 55.7 |
Last first innings: 150/3, 136/6, 143/5, 132/4
| Phase | Run rate | Wkts |
|---|---|---|
| powerplay | 5.71 | 9 |
| middle | 6.17 | 19 |
| death | 8.22 | 15 |
Based on 4 matches.
Last first innings: 170/8, 205/4, 202/8, 198/5, 135/7
| Phase | Run rate | Wkts |
|---|---|---|
| powerplay | 7.12 | 187 |
| middle | 7.49 | 243 |
| death | 9.23 | 243 |
Based on 58 matches.
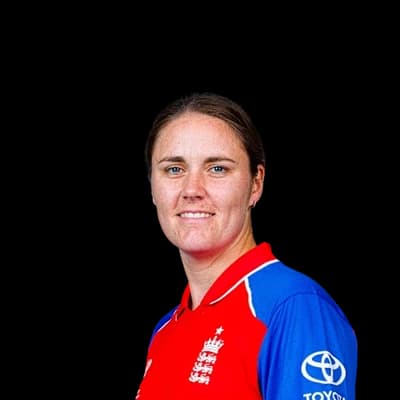 Natalie Sciver57
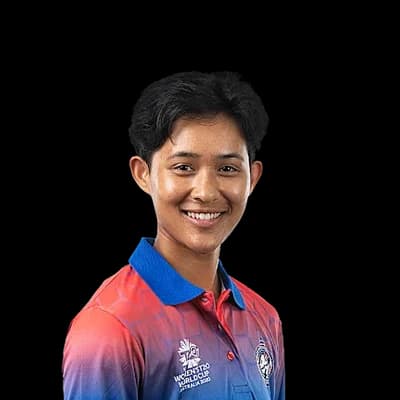 Nattankan Chantam56
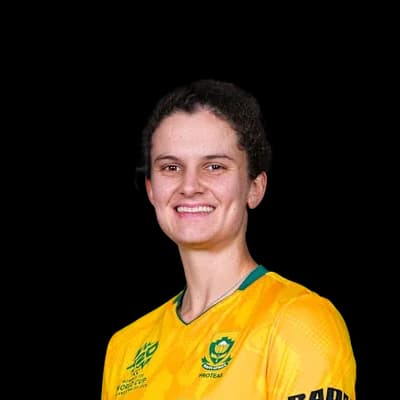 Laura Wolvaardt53
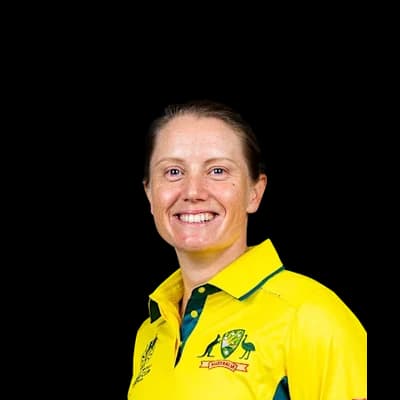 Alyssa Healy51
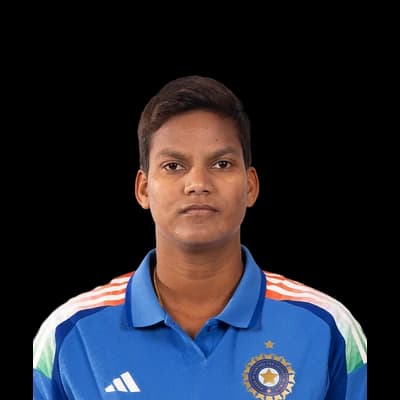 Deepti Sharma49
 Poonam Yadav4
 Shikha Pandey3
 Diana Baig3
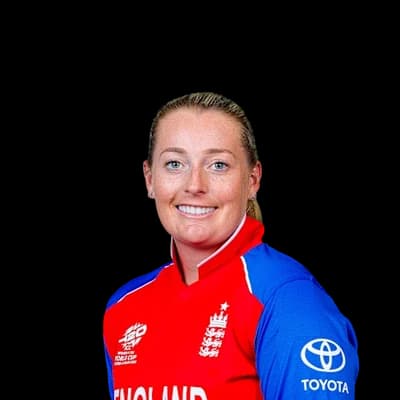 Sophie Ecclestone3
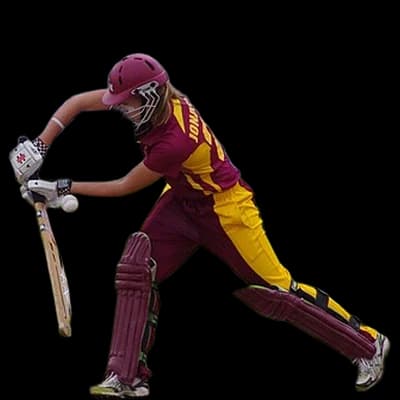 Jess Jonassen2
 Cameron Bancroft423
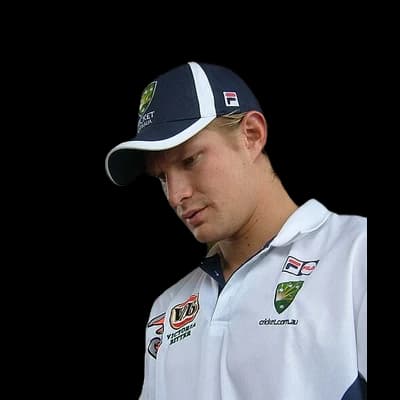 Shane Watson388
 Usman Khawaja323
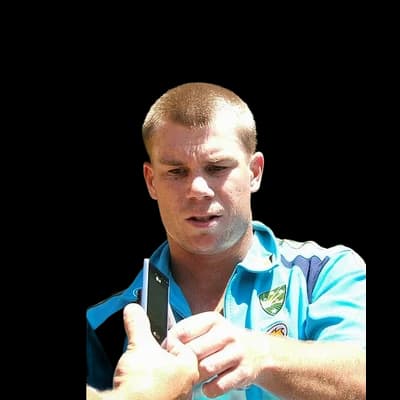 David Warner323
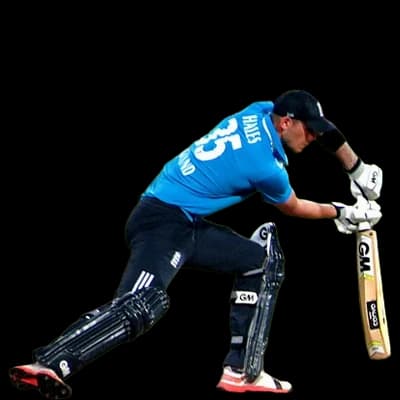 Alex Hales321
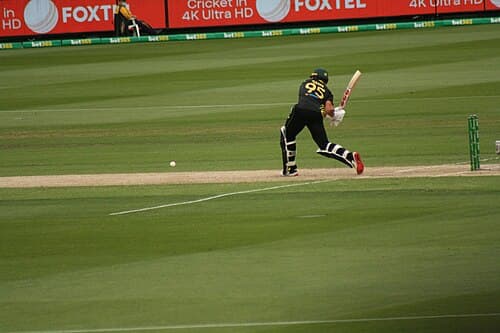 Daniel Sams41
 Chris Green25Fawad Ahmed23Gurinder Sandhu17Nathan McAndrew17
Photos: ICC, BCCI, President's Secretariat, GODL-India, via Wikimedia Commons, Ministry of Defence, GODL-India, via Wikimedia Commons, Naparazzi, CC BY-SA 2.0, via Wikimedia Commons, paddynapper, CC BY-SA 2.0, via Wikimedia Commons, YellowMonkey/Blnguyen, CC BY-SA 4.0, via Wikimedia Commons, Amal316, CC BY-SA 4.0, via Wikimedia Commons, Neb, CC BY-SA 4.0, via Wikimedia Commons, Servite et contribuere, CC0, via Wikimedia Commons
20°C
partly cloudy
Feels 19°C · Humidity 58% · Wind 10.4 km/h · Cloud 58%
Rain outlook: small chance of a shower
Dew: likely – Heavy dew is likely from about 03:00; the side bowling second may find the ball wet.
| Team | Format | P | W | L | Win % | Avg | Highest |
|---|---|---|---|---|---|---|---|
| Sydney Thunder | T20 | 43 | 16 | 23 | 37% | 134 | 205 |
| Perth Scorchers | T20 | 10 | 5 | 4 | 50% | 148 | 202 |
| Sydney Sixers | T20 | 10 | 5 | 3 | 50% | 137 | 198 |
| Sydney Thunder | T20 | 10 | 6 | 4 | 60% | 128 | 190 |
| Adelaide Strikers | T20 | 7 | 3 | 4 | 43% | 140 | 178 |
| Melbourne Renegades | T20 | 6 | 1 | 4 | 17% | 132 | 165 |
| Sydney Sixers | T20 | 6 | 3 | 3 | 50% | 132 | 164 |
| Brisbane Heat | T20 | 5 | 4 | 1 | 80% | 158 | 203 |
Melbourne Renegades 170/8 (20.0) · Sydney Thunder 140/6 (15.2)
Sydney Thunder 205/4 (20.0) · Hobart Hurricanes 207/4 (17.5)
Perth Scorchers 202/8 (20.0) · Sydney Thunder 131/10 (17.3)
Sydney Sixers 198/5 (20.0) · Sydney Thunder 151/10 (19.1)
Sydney Thunder 135/7 (19.0) · Melbourne Stars 114/10 (18.0)
The average first-innings score at Sydney Showground Stadium in T20s is 148, across 58 matches in our records. The par score (middle of the last 10 first innings) is 163.
In T20s at Sydney Showground Stadium, sides batting first have won 49% of decided matches (27) and chasing sides 51% (28). Evenly balanced between batting first and chasing.
The highest T20 total at Sydney Showground Stadium is 207, and the lowest is 15.
The highest successful T20 chase at Sydney Showground Stadium is 207. The lowest total defended is 76.
Pace bowlers have taken 68% of the wickets (with a known bowling type) in T20s at Sydney Showground Stadium, and spinners 32%.
Captains winning the toss in T20s at Sydney Showground Stadium chose to field 69% of the time, and the toss winner went on to win 55% of matches.
Cameron Bancroft has scored the most T20 runs at Sydney Showground Stadium: 423 in 13 innings, averaging 47.
Daniel Sams has taken the most T20 wickets at Sydney Showground Stadium: 41 in 26 innings at an economy of 8.26.
Counted from UC Cricket's own ball-by-ball records; rebuilt nightly. Weather refreshes every few minutes.
