Brisbane, Australia · Capacity 42,000 · Opened 1895 · 175 matches on record
ODI Evenly balanced between batting first and chasing at Brisbane Cricket Ground, based on 25 decided matches.
| Format | M | Avg 1st | Avg 2nd | Bat 1st won | Chased | Highest | Lowest | Top chase | Low defended | RR | Bdry % |
|---|---|---|---|---|---|---|---|---|---|---|---|
| T20I | 11 | 151 | 138 | 8 | 2 | 209 | 52 | 161 | 93 | 8.44 | 54.4 |
| ODI | 29 | 246 | 212 | 12 | 13 | 324 | 43 | 309 | 235 | 5.24 | 38.8 |
| Test | 22 | 348 | 345 | 11 | 7 | 602 | 8 | 511 | 144 | 3.45 | 49.6 |
| T20 | 74 | 166 | 153 | 31 | 41 | 258 | 10 | 258 | 132 | 8.47 | 55 |
| List A | 5 | 233 | 171 | 3 | 2 | 361 | 131 | 153 | 260 | 5.40 | 46.6 |
| First-class | 23 | 262 | 293 | 7 | 11 | 600 | 32 | 430 | 147 | 2.99 | 51.7 |
Last first innings: 52/0, 93/4, 179/6, 179/5, 150/7
| Phase | Run rate | Wkts |
|---|---|---|
| powerplay | 7.46 | 38 |
| middle | 8.67 | 47 |
| death | 9.63 | 43 |
Based on 11 matches.
Last first innings: 270/9, 268/9, 308/8, 235/7, 278/9
| Phase | Run rate | Wkts |
|---|---|---|
| powerplay | 4.68 | 85 |
| middle | 4.92 | 203 |
| death | 7.31 | 130 |
Based on 29 matches.
Last first innings: 334/10, 445/10, 311/10, 152/10, 147/10
| Phase | Run rate | Wkts |
|---|---|---|
| first | 3.32 | 230 |
| middle | 3.41 | 237 |
| late | 3.67 | 207 |
Based on 22 matches.
Last first innings: 171/9, 180/6, 195/6, 179/9, 257/6
| Phase | Run rate | Wkts |
|---|---|---|
| powerplay | 8.06 | 246 |
| middle | 8.02 | 349 |
| death | 10.01 | 327 |
Based on 74 matches.
Last first innings: 260/10, 131/10, 150/10, 361/3, 264/9
| Phase | Run rate | Wkts |
|---|---|---|
| powerplay | 4.34 | 17 |
| middle | 5.45 | 50 |
| death | 7.89 | 13 |
Based on 5 matches.
Last first innings: 185/10, 318/9, 429/7, 147/10, 387/10
| Phase | Run rate | Wkts |
|---|---|---|
| first | 2.70 | 261 |
| middle | 3.03 | 278 |
| late | 3.47 | 195 |
Based on 23 matches.
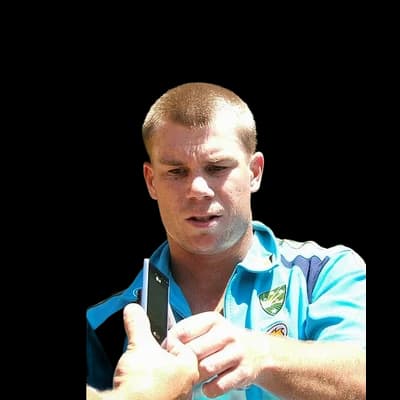 David Warner145
 Aaron Finch109
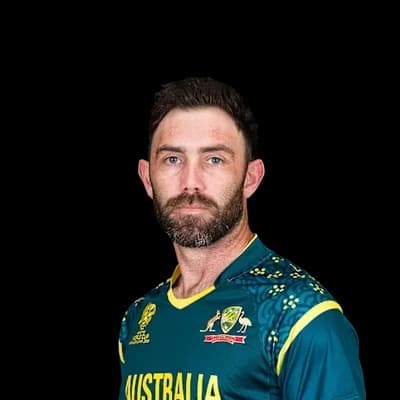 Glenn Maxwell103
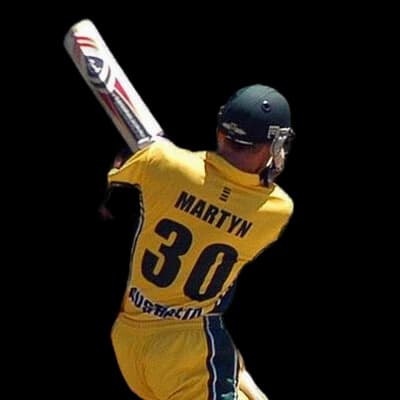 Damien Martyn96
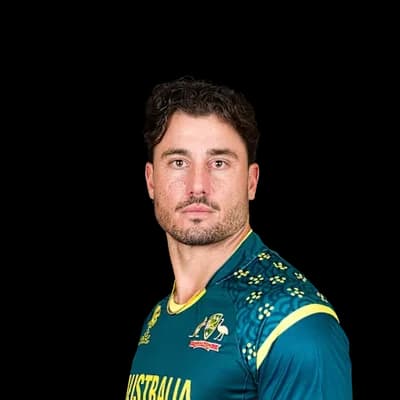 Marcus Stoinis89
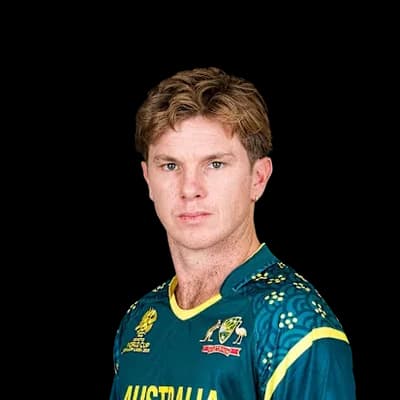 Adam Zampa9
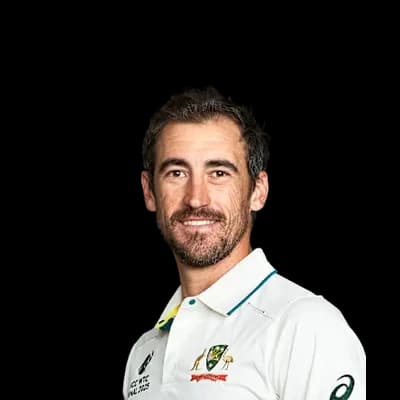 Mitchell Starc6
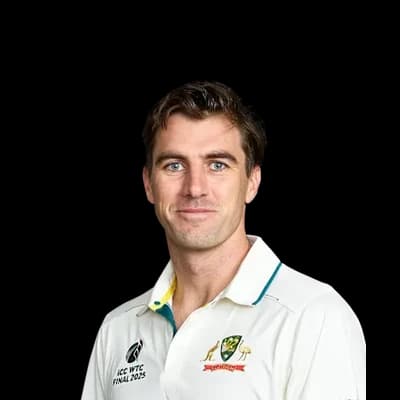 Pat Cummins6
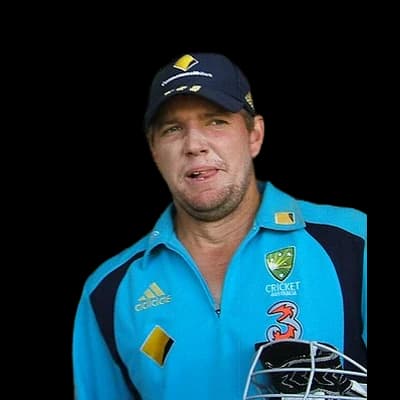 James Hopes4
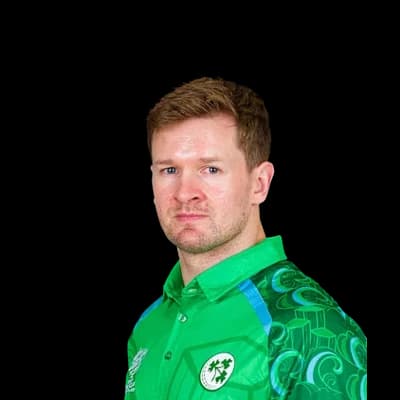 Barry McCarthy3
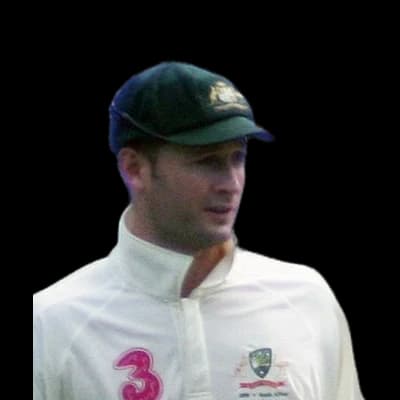 Michael Clarke332
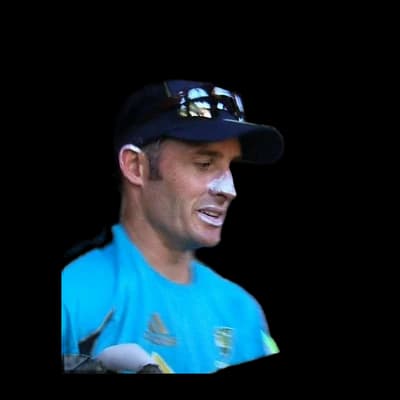 Michael Hussey314David Warner270
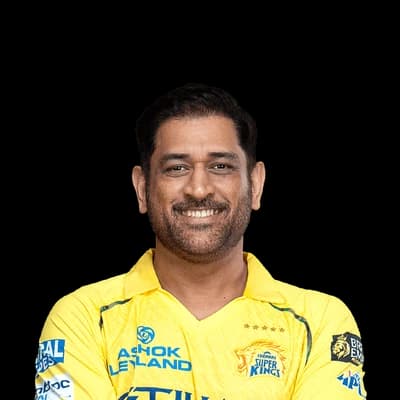 MS Dhoni262
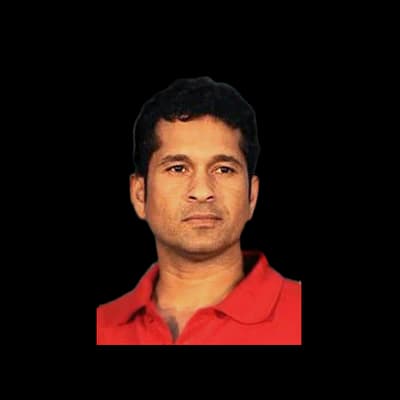 Sachin Tendulkar247
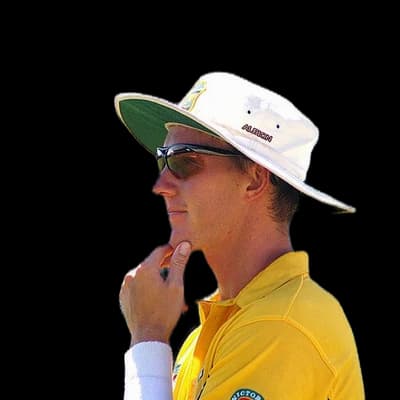 Brett Lee19Mitchell Starc13
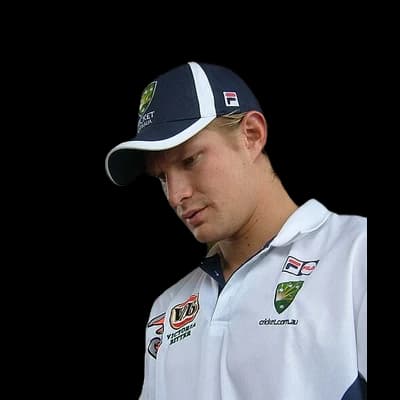 Shane Watson13
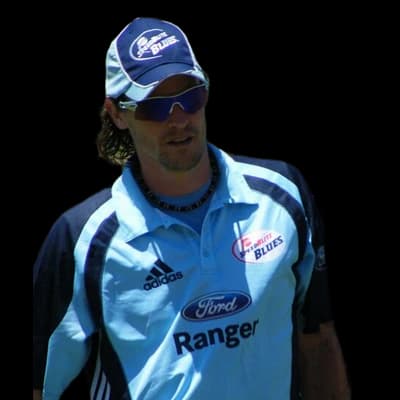 Nathan Bracken13
 Irfan Pathan11Michael Clarke1011
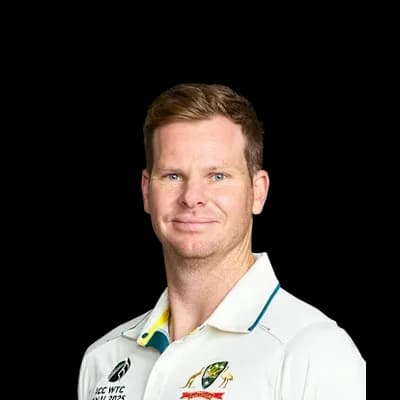 Steven Smith1010David Warner963
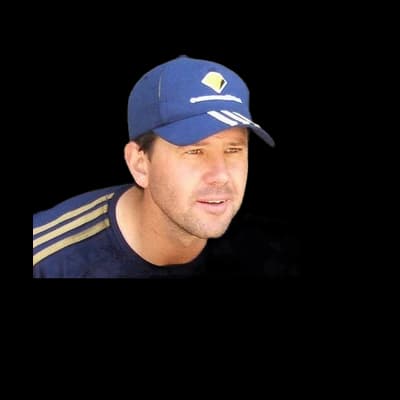 Ricky Ponting682Michael Hussey630Mitchell Starc58
 Nathan Lyon52Pat Cummins44
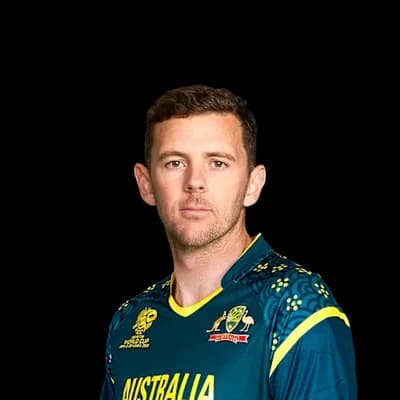 Josh Hazlewood38
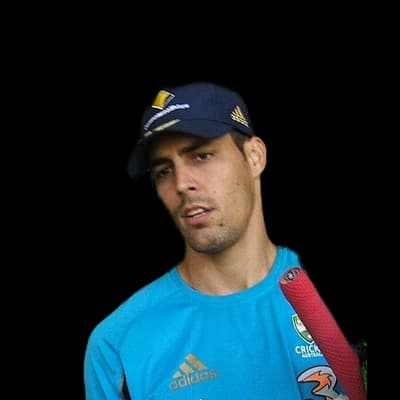 Mitchell Johnson34
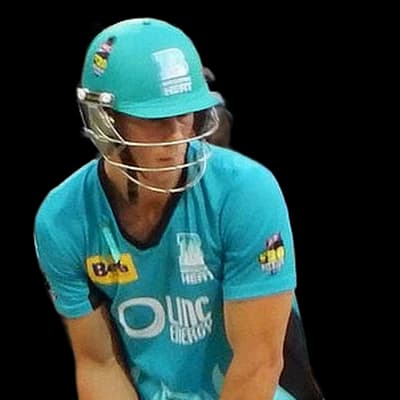 Chris Lynn1183
 Max Bryant793
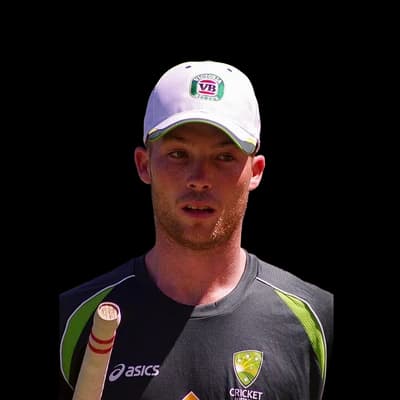 Jimmy Peirson779
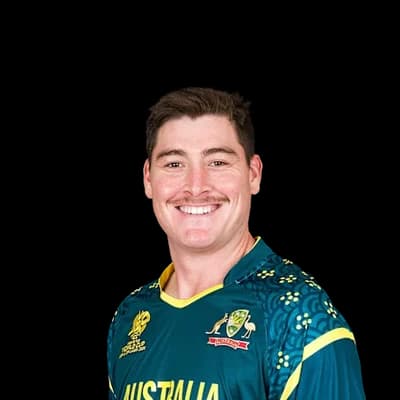 Matt Renshaw672
 Ben Cutting648
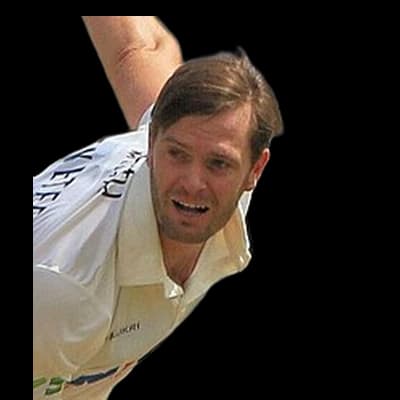 Mark Steketee50
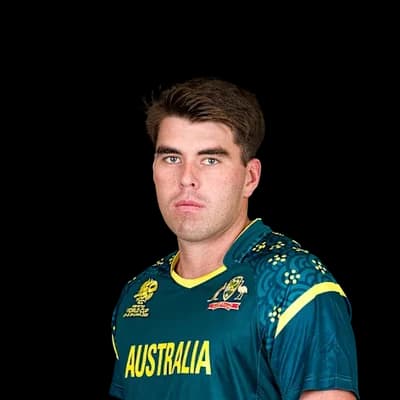 Xavier Bartlett37Ben Cutting28Mitchell Swepson26
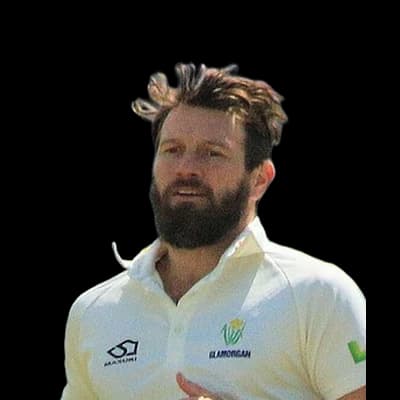 Michael Neser24
Photos: YellowMonkey/Blnguyen, CC BY-SA 4.0, via Wikimedia Commons, Supun47, CC BY-SA 3.0, via Wikimedia Commons, ICC, Taken with Nikon D100 by Wayne McLean archive copy at the Wayback Machine ( jgri, CC BY-SA 2.5, via Wikimedia Commons, self, CC BY-SA 2.5, via Wikimedia Commons, IPL, Bollywood Hungama, CC BY 3.0, via Wikimedia Commons, CC BY-SA 2.5, via Wikimedia Commons, paddynapper, CC BY-SA 2.0, via Wikimedia Commons, Haley Jackson, CC BY 2.0, via Wikimedia Commons, NAPARAZZI, CC BY-SA 2.0, via Wikimedia Commons, Dave Morton, Public domain, via Wikimedia Commons
27°C
thunderstorm
Feels 31°C · Humidity 63% · Wind 8.3 km/h · Cloud 70%
Rain outlook: rain very likely to interrupt
Dew: likely – Heavy dew is likely from about 18:00; the side bowling second may find the ball wet.
| Month | High | Low | Rain mm | Rain days |
|---|---|---|---|---|
| January | 30° | 21° | 125.9 | 15.6 |
| February | 29° | 21° | 163 | 12.6 |
| March | 28° | 20° | 194.3 | 16.5 |
| April | 26° | 17° | 54.5 | 8.7 |
| May | 23° | 14° | 79.7 | 8.5 |
| June | 21° | 11° | 44.6 | 6.6 |
| July | 21° | 10° | 39.8 | 5.8 |
| August | 23° | 11° | 31.2 | 5.3 |
| September | 25° | 13° | 41.2 | 6.1 |
| October | 27° | 16° | 116.8 | 10.5 |
| November | 28° | 18° | 114.8 | 11.5 |
| December | 29° | 20° | 116.8 | 12.5 |
| Team | Format | P | W | L | Win % | Avg | Highest |
|---|---|---|---|---|---|---|---|
| Brisbane Heat | T20 | 72 | 31 | 34 | 43% | 162 | 258 |
| Queensland | First-class | 26 | 7 | 11 | 27% | 222 | 600 |
| Australia | Test | 23 | 16 | 2 | 70% | 323 | 602 |
| Australia | ODI | 20 | 12 | 5 | 60% | 223 | 324 |
| Hobart Hurricanes | T20 | 14 | 7 | 6 | 50% | 166 | 210 |
| Sydney Sixers | T20 | 12 | 8 | 2 | 67% | 161 | 209 |
| Adelaide Strikers | T20 | 11 | 5 | 5 | 45% | 154 | 179 |
| Sydney Thunder | T20 | 11 | 2 | 7 | 18% | 168 | 196 |
Queensland 260/10 (49.2) · South Australia 135/9 (26.1)
Queensland 185/10 (66.5) · South Australia 214/10 (72.1) · Queensland 119/10 (51.0) · South Australia 91/3 (37.0)
Brisbane Heat 171/9 (20.0) · Sydney Sixers 177/5 (18.4)
Sydney Thunder 180/6 (20.0) · Brisbane Heat 183/3 (16.2)
Melbourne Stars 195/6 (20.0) · Brisbane Heat 199/6 (19.4)
The average first-innings score at Brisbane Cricket Ground in ODIs is 246, across 29 matches in our records. The par score (middle of the last 10 first innings) is 278.
In ODIs at Brisbane Cricket Ground, sides batting first have won 48% of decided matches (12) and chasing sides 52% (13). Evenly balanced between batting first and chasing.
The highest ODI total at Brisbane Cricket Ground is 324, and the lowest is 43.
The highest successful ODI chase at Brisbane Cricket Ground is 309. The lowest total defended is 235.
Pace bowlers have taken 82% of the wickets (with a known bowling type) in ODIs at Brisbane Cricket Ground, and spinners 18%.
Captains winning the toss in ODIs at Brisbane Cricket Ground chose to field 17% of the time, and the toss winner went on to win 48% of matches.
Michael Clarke has scored the most ODI runs at Brisbane Cricket Ground: 332 in 12 innings, averaging 33.2.
Brett Lee has taken the most ODI wickets at Brisbane Cricket Ground: 19 in 11 innings at an economy of 5.19.
Counted from UC Cricket's own ball-by-ball records; rebuilt nightly. Weather refreshes every few minutes.


