Perth, Australia · Capacity 20,000 · Opened 1890 · 199 matches on record
ODI Evenly balanced between batting first and chasing at Western Australia Cricket Association Ground, based on 28 decided matches.
| Format | M | Avg 1st | Avg 2nd | Bat 1st won | Chased | Highest | Lowest | Top chase | Low defended | RR | Bdry % |
|---|---|---|---|---|---|---|---|---|---|---|---|
| T20I | 7 | 130 | 121 | 2 | 5 | 186 | 78 | 135 | 142 | 6.55 | 51.7 |
| ODI | 28 | 243 | 218 | 14 | 14 | 343 | 70 | 310 | 231 | 5.11 | 44.3 |
| Test | 15 | 340 | 322 | 12 | 2 | 735 | 28 | 323 | 76 | 3.58 | 55.7 |
| T20 | 76 | 148 | 136 | 37 | 38 | 203 | 29 | 186 | 69 | 7.46 | 53.9 |
| List A | 28 | 238 | 206 | 10 | 14 | 387 | 53 | 319 | 205 | 5.50 | 52.1 |
| First-class | 33 | 267 | 281 | 11 | 14 | 574 | 9 | 519 | 114 | 3.04 | 52.6 |
Last first innings: 122/6, 142/6, 123/8, 78/9, 127/7
| Phase | Run rate | Wkts |
|---|---|---|
| powerplay | 5.76 | 22 |
| middle | 6.28 | 29 |
| death | 8.29 | 35 |
Based on 7 matches.
Last first innings: 298/6, 241/10, 263/7, 309/3, 182/10
| Phase | Run rate | Wkts |
|---|---|---|
| powerplay | 4.51 | 90 |
| middle | 4.89 | 227 |
| death | 6.90 | 122 |
Based on 28 matches.
Last first innings: 198/10, 76/10, 403/10, 242/10, 559/9
| Phase | Run rate | Wkts |
|---|---|---|
| first | 3.44 | 159 |
| middle | 3.36 | 179 |
| late | 4.07 | 170 |
Based on 15 matches.
Last first innings: 173/5, 164/7, 184/5, 159/4, 109/10
| Phase | Run rate | Wkts |
|---|---|---|
| powerplay | 7.01 | 212 |
| middle | 7.27 | 340 |
| death | 8.49 | 339 |
Based on 76 matches.
Last first innings: 371/8, 299/7, 232/10, 115/10, 205/10
| Phase | Run rate | Wkts |
|---|---|---|
| powerplay | 5.00 | 84 |
| middle | 5.56 | 169 |
| death | 7.52 | 89 |
Based on 28 matches.
Last first innings: 440/6, 307/10, 431/9, 239/10, 390/10
| Phase | Run rate | Wkts |
|---|---|---|
| first | 2.78 | 368 |
| middle | 3.12 | 448 |
| late | 3.32 | 300 |
Based on 33 matches.
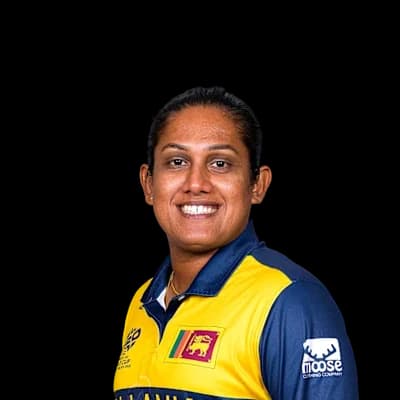 Chamari Athapaththu91
 Andrew Symonds85
 Sophie Devine75
 Jacob Oram66
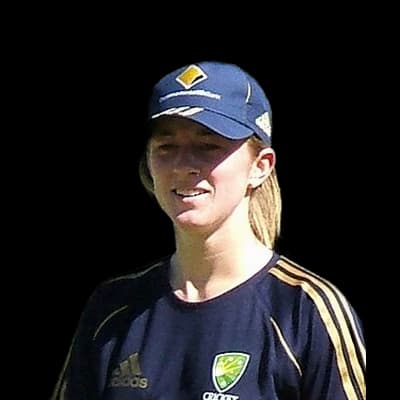 Rachael Haynes60
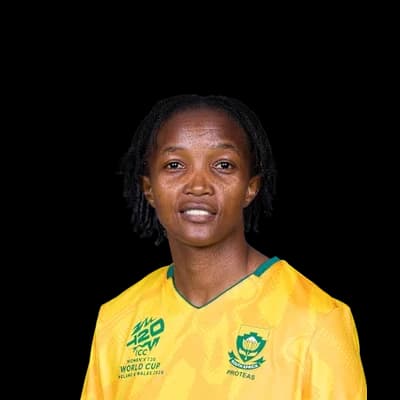 Ayabonga Khaka3
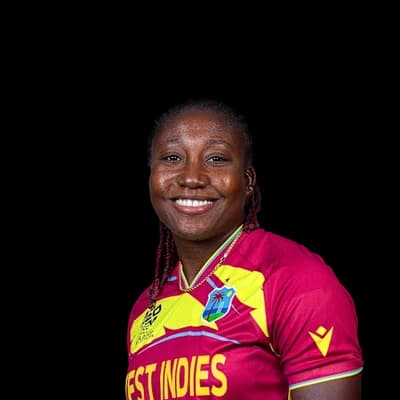 Stafanie Taylor3
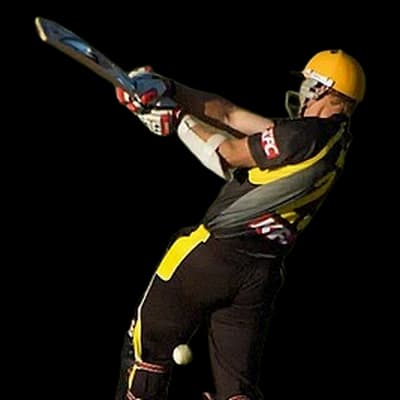 Ashley Noffke3
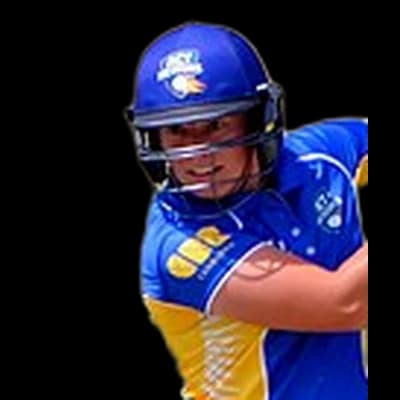 Hayley Jensen3
 Poonam Yadav3
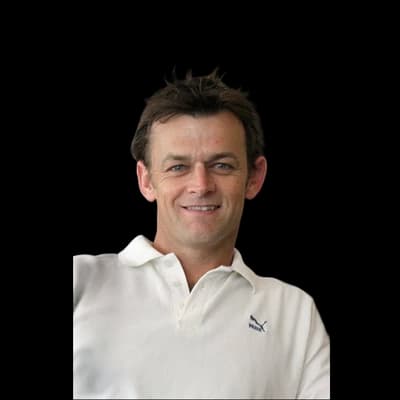 Adam Gilchrist369
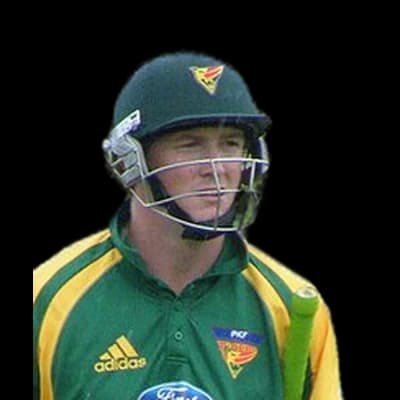 George Bailey345
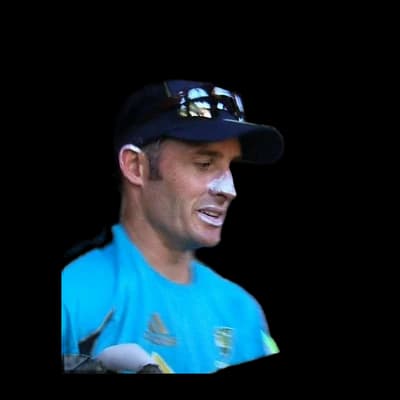 Michael Hussey328
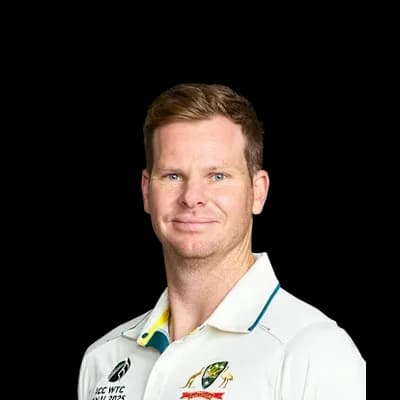 Steven Smith326
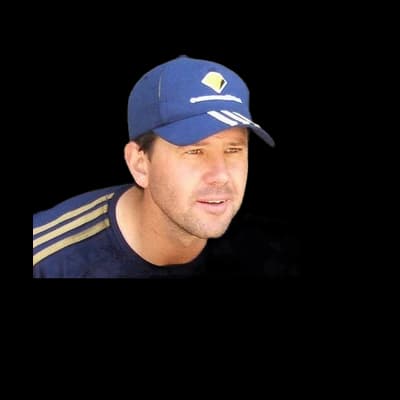 Ricky Ponting268
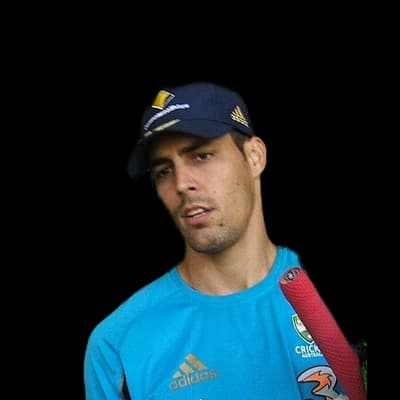 Mitchell Johnson17
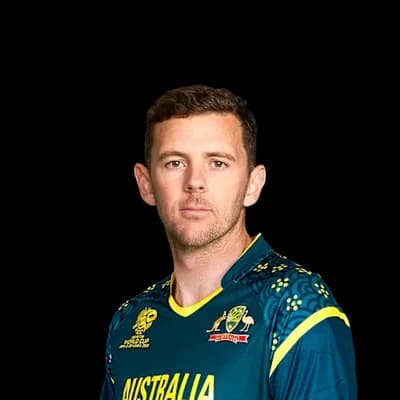 Josh Hazlewood12
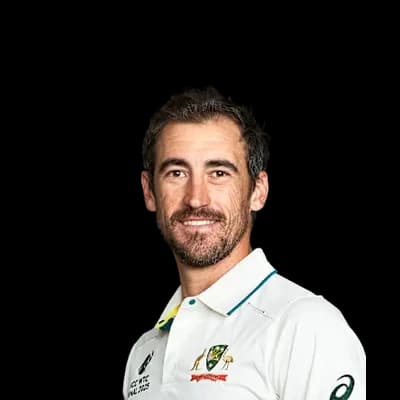 Mitchell Starc12
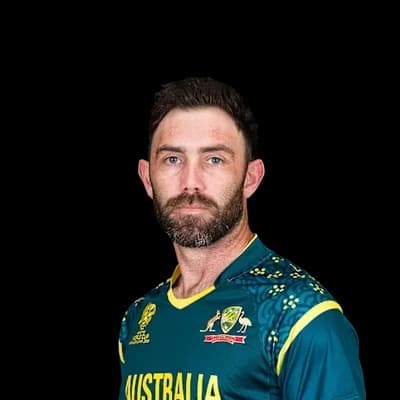 Glenn Maxwell11
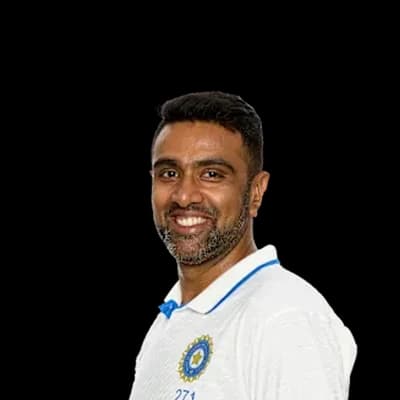 Ravichandran Ashwin10
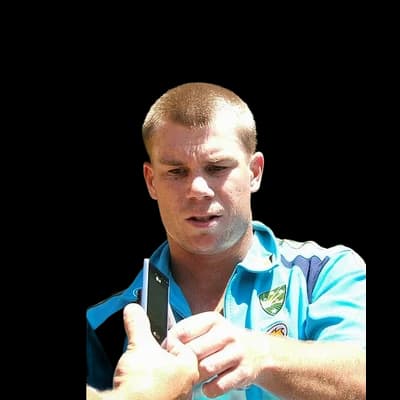 David Warner825Steven Smith607
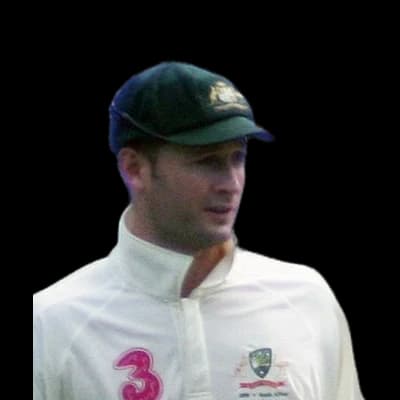 Michael Clarke565Michael Hussey559
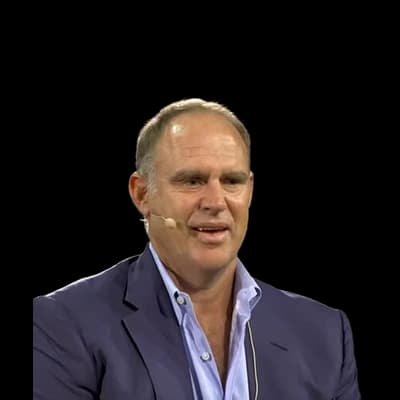 Matthew Hayden526Mitchell Johnson45Mitchell Starc26
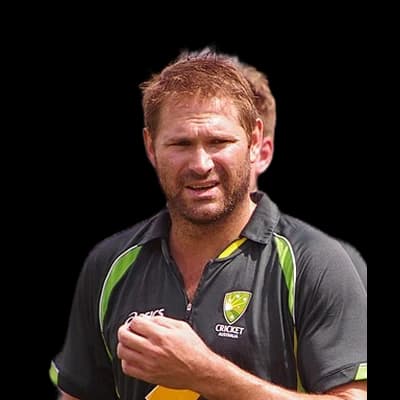 Ryan Harris15
 Nathan Lyon15
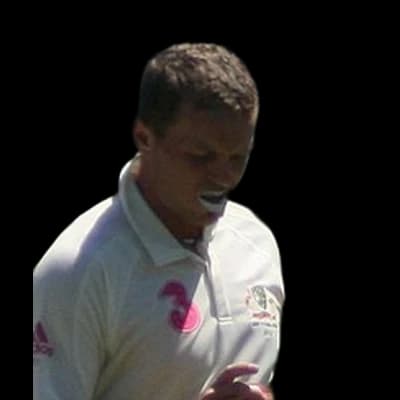 Peter Siddle15
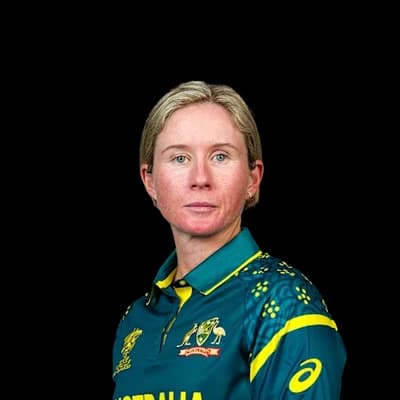 Beth Mooney700
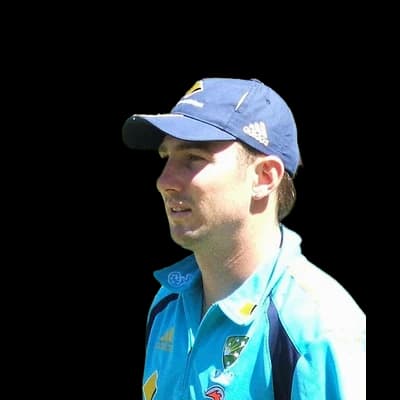 Shaun Marsh681
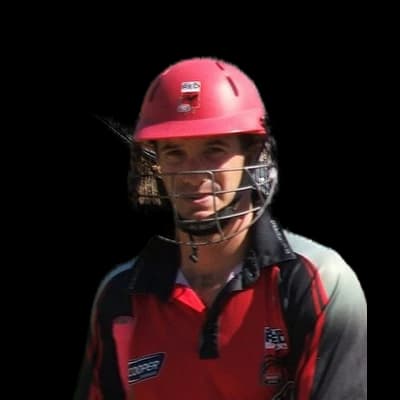 Michael Klinger570
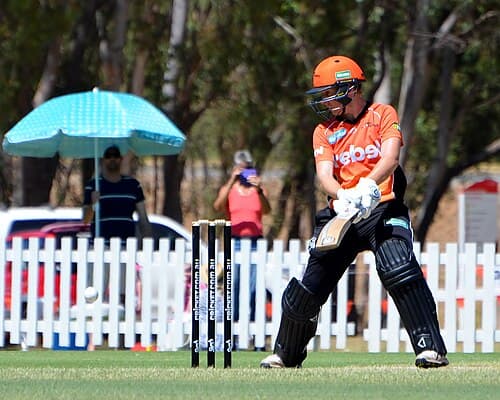 Elyse Villani489
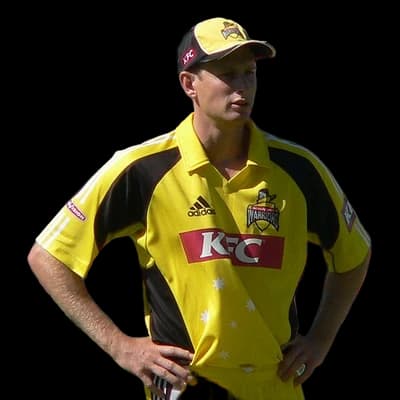 Adam Voges473
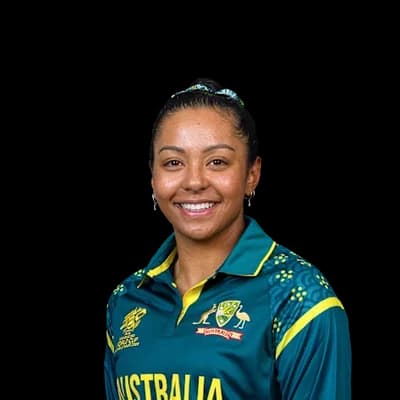 Alana King30
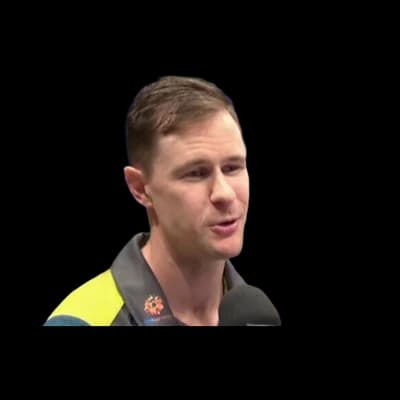 Jason Behrendorff27
 Andrew Tye24
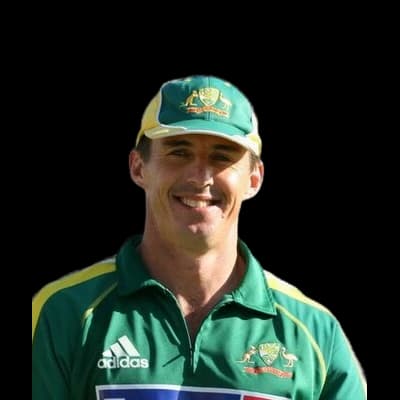 Brad Hogg23
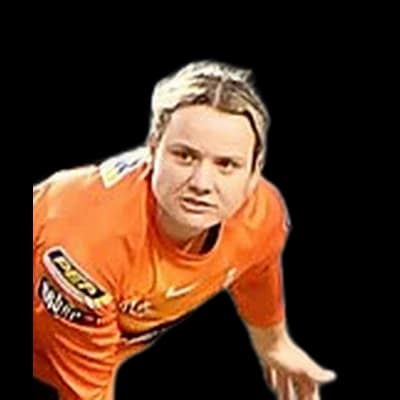 Lilly Mills21
Photos: ICC, WYD ebenedict.org Sydney, CC BY 2.0, via Wikimedia Commons, YellowMonkey, CC BY-SA 3.0, via Wikimedia Commons, Helenabella, CC BY-SA 3.0, via Wikimedia Commons, Bahnfrend, CC BY-SA 4.0, via Wikimedia Commons, President's Secretariat, GODL-India, via Wikimedia Commons, Luton Anderson, CC BY-SA 2.0, via Wikimedia Commons, NAPARAZZI, CC BY-SA 2.0, via Wikimedia Commons, YellowMonkey/Blnguyen, CC BY-SA 4.0, via Wikimedia Commons, self, CC BY-SA 2.5, via Wikimedia Commons, Indian yogi and author Sadhguru, on Youtube, CC BY 3.0, via Wikimedia Commons, PrivateMusings, CC BY-SA 2.5, via Wikimedia Commons, The-Pope, CC BY-SA 3.0, via Wikimedia Commons, CRICKETNEXT, CC BY 3.0, via Wikimedia Commons, www.davidmolloyphotography.com from Sydney, Australia, CC BY 2.0, via Wikimedia Commons, BradleyHogg.jpg: Deon Maritz from Cape Town, South Africa derivative work: Ignor, CC BY 2.0, via Wikimedia Commons
22°C
clear
Feels 22°C · Humidity 40% · Wind 10.7 km/h · Cloud 0%
Rain outlook: no rain expected
Dew: unlikely – No dew expected this evening.
| Team | Format | P | W | L | Win % | Avg | Highest |
|---|---|---|---|---|---|---|---|
| Perth Scorchers | T20 | 35 | 25 | 10 | 71% | 153 | 203 |
| Western Australia | First-class | 35 | 16 | 9 | 46% | 253 | 574 |
| Perth Scorchers | T20 | 34 | 23 | 11 | 68% | 137 | 194 |
| Western Australia | List A | 22 | 13 | 5 | 59% | 231 | 387 |
| Australia | ODI | 19 | 14 | 5 | 74% | 243 | 343 |
| Australia | Test | 13 | 8 | 4 | 62% | 372 | 735 |
| Western Australia Women | List A | 12 | 3 | 3 | 25% | 215 | 273 |
| Melbourne Stars | T20 | 10 | 3 | 6 | 30% | 135 | 163 |
New South Wales 371/8 (50.0) · Western Australia 293/10 (46.3)
NSW won by 78 runs
New South Wales 440/6 (110.0) · Western Australia 339/10 (105.1) · New South Wales 262/5 (51.3) · Western Australia 244/9 (111.0)
Match Drawn
Queensland 307/10 (90.3) · Western Australia 175/10 (73.1) · Queensland 68/10 (25.1) · Western Australia 201/8 (72.5)
WA won by 2 wickets
Tasmania Women 299/7 (50.0) · Western Australia Women 273/7 (50.0)
TAS-W won by 26 runs
Tasmania Women 232/10 (45.0) · Western Australia Women 236/6 (35.2)
WA-W won by 4 wickets
Western Australia 115/10 (30.2) · Tasmania 117/1 (16.2)
TT won by 9 wickets
The average first-innings score at Western Australia Cricket Association Ground in ODIs is 243, across 28 matches in our records. The par score (middle of the last 10 first innings) is 263.
In ODIs at Western Australia Cricket Association Ground, sides batting first have won 50% of decided matches (14) and chasing sides 50% (14). Evenly balanced between batting first and chasing.
The highest ODI total at Western Australia Cricket Association Ground is 343, and the lowest is 70.
The highest successful ODI chase at Western Australia Cricket Association Ground is 310. The lowest total defended is 231.
Pace bowlers have taken 75% of the wickets (with a known bowling type) in ODIs at Western Australia Cricket Association Ground, and spinners 25%.
Captains winning the toss in ODIs at Western Australia Cricket Association Ground chose to field 36% of the time, and the toss winner went on to win 29% of matches.
Adam Gilchrist has scored the most ODI runs at Western Australia Cricket Association Ground: 369 in 5 innings, averaging 73.8.
Mitchell Johnson has taken the most ODI wickets at Western Australia Cricket Association Ground: 17 in 12 innings at an economy of 4.61.
Counted from UC Cricket's own ball-by-ball records; rebuilt nightly. Weather refreshes every few minutes.
